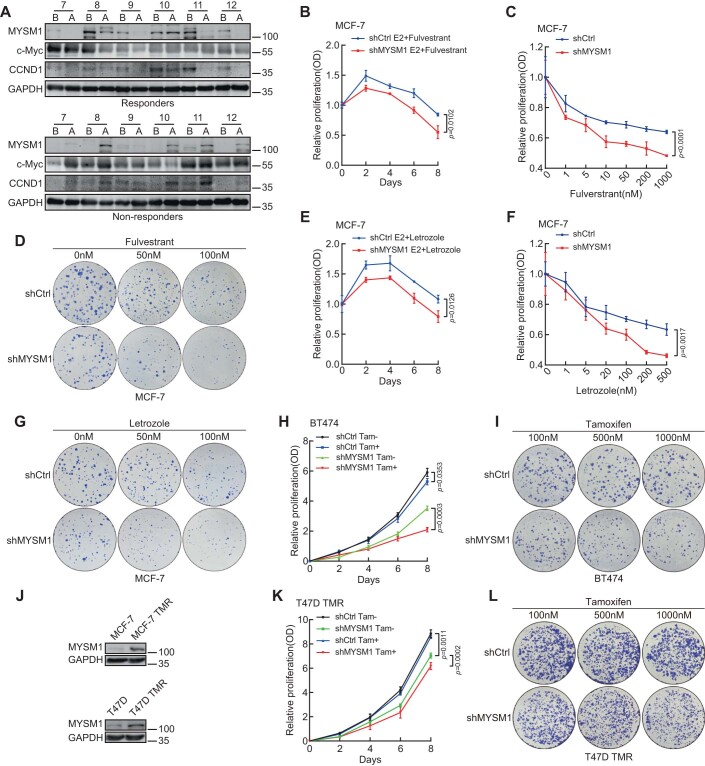
Figure EV5. MYSM1 depletion subjects ERα-positive breast cancer cells to endocrine treatment.
(A) MYSM1 and CCND1 protein expression in the “Responders” and “Non-responders” samples before and after AI treatment were examined by western blot. “B” represents cases before AI treatment, “A” represents cases after AI treatment (n = 6). (B, E) Growth curve showing the effect of MYSM1 knockdown on MCF-7 cell proliferation with Fulverstrant (200 nM) (B) or Letrozole (100 nM) (E) treatment. Total cell viability was assessed every other day by MTS assay. (C, F) A cellular viability detection in MYSM1-deletion MCF-7 cells that incubated in various concentrations of Fulverstrant (C) or Letrozole (F) for 7 days. (D, G) MCF-7 cells with/without MYSM1 knockdown were subjected to colony formation assay under diverse doses of Fulverstrant (D) or Letrozole (G). Clones were stained with R250 and photographed 2 weeks later. (H, K) The line chart renders the relative proliferation of the shMYSM1 group compared to the shCtrl group in BT474 (H) or T47D TMR (K) cells in the stimulation of Tamoxifen (1 μM) or not. (I, L) The panels show colony-formation assay conducted in BT474 (I) or T47D TMR (L) cells infected with lentivirus expressing shCtrl/shMYSM1. Cells in each panel were treated with different doses of Tamoxifen for 15 days before fixation and R250 staining. (J) Western blot assay detecting MYSM1 protein expression in MCF-7, T47D, and their corresponding Tamoxifen-resistant (TMR) cells. Data information: *P < 0.05, **P < 0.01, ***P < 0.001 (mean ± SD; Student’s t test; n = 3 independent experiments).

