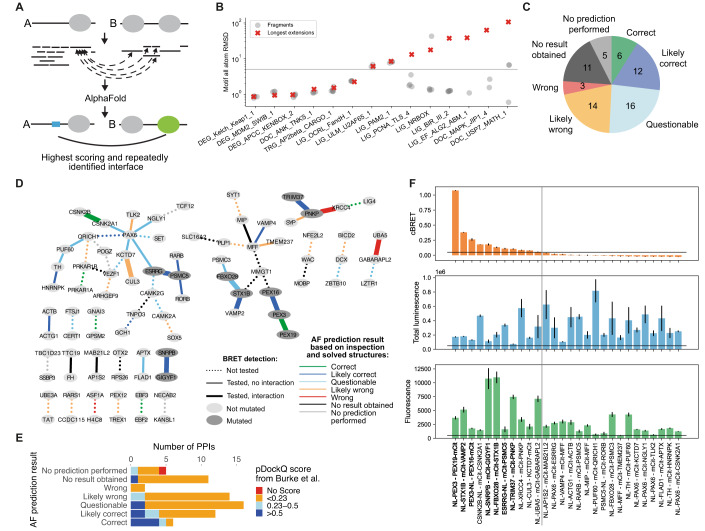
Figure 3. AF prediction and experiments on PPIs connecting NDD proteins.
(A) Schematic of the fragmentation approach applied on a pair of interacting proteins, A and B. Proteins are fragmented into folded and disordered regions based on manual inspection. Disordered regions are further fragmented. All disordered and folded fragments of one protein are paired with the folded regions of the other protein and vice versa for AF prediction. (B) Accuracy measured in motif RMSD compared to native structures for models obtained from fragmenting proteins from 20 DMIs from the positive reference dataset and comparison to model accuracy obtained when using (near) full length proteins for structure prediction (red crosses). Only models that meet the cutoff for identifying high confident models are shown. Six DMIs did not result in any such model. The gray horizontal line indicates the RMSD cutoff used to identify accurate models (see methods for details). (C) AF prediction outcome on 67 HuRI PPIs connecting NDD proteins. (D) PPI networks illustrating AF prediction outcomes and experimental retesting of PPIs in BRET assay. (E) Number of PPIs connecting NDD proteins with structural models at indicated pDockQ cutoffs from (Burke et al, 2023) grouped based on AF prediction outcomes using the fragmentation approach as shown in (C). (F) cBRET, total luminescence, and fluorescence for 28 PPIs connecting NDD proteins that were tested in the BRET assay. Luminescence and fluorescence measurements indicate expression levels of NL and mCit fusion proteins, respectively. Black horizontal lines indicate expression level and PPI detection cutoffs. The gray vertical line separates the detected (left) from undetected PPIs. Protein pairs in bold indicate those selected for interface validation via site-directed mutagenesis. Error bars indicate STD of three technical replicates. Source data are available online for this figure.

