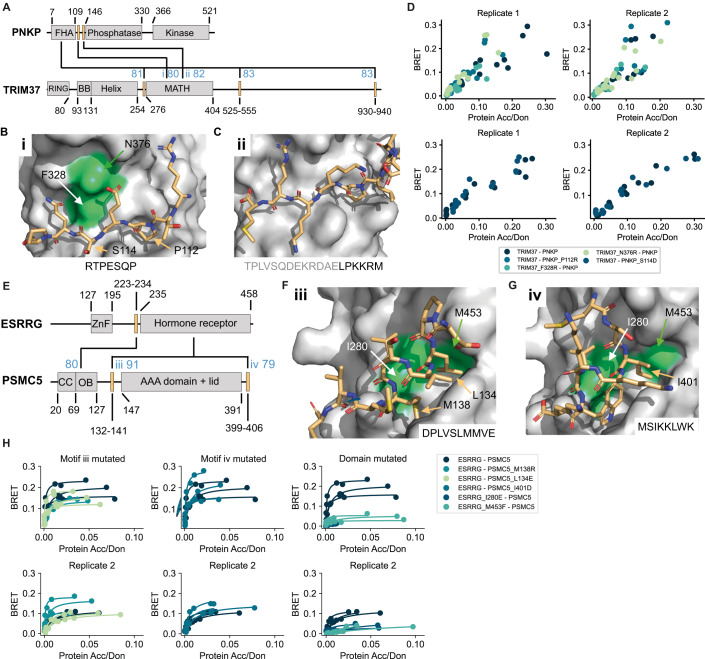
Figure 4. Verification of interface predictions for TRIM37-PNKP and ESRRG-PSMC5.
(A) Schematic of the domain architecture of PNKP and TRIM37 with indication of top predicted interfaces. Numbers in blue indicate the motif interface pLDDT for the respective interface. Roman numbering refers to structural models in (B) and (C). (B) Structural model of interface i shown in (A) with labeled residues that were mutated. (C) Structural model of interface ii shown in (A). (D) BRET titration curves are shown for wildtype interaction and mutants for two biological replicates, each with three technical replicates. Protein acceptor over protein donor expression levels are plotted on the x-axis determined from fluorescence and luminescence measurements, respectively. The BRET trajectory could not be fitted because of an unusual saturation behavior (see methods for details). (E) Schematic of the domain architecture of ESRRG and PSMC5 with indication of top predicted interfaces. Numbers in blue indicate the motif interface pLDDT for the respective interface. Roman numbering refers to structural models in (F) and (G). (F) Structural model of interface iii shown in (E) with labeled residues that were mutated. (G) Structural model of interface iv shown in (E). (H) BRET titration curves are shown for wildtype interaction and mutants of ESRRG-PSMC5 pairs for two biological replicates, each with three technical replicates. Protein acceptor over protein donor expression levels are plotted on the x-axis determined from fluorescence and luminescence measurements, respectively. In panels (B), (C), (F), and (G) motif sequences are indicated at the bottom. Gray letters indicate residues not predicted to bind. Source data are available online for this figure.

