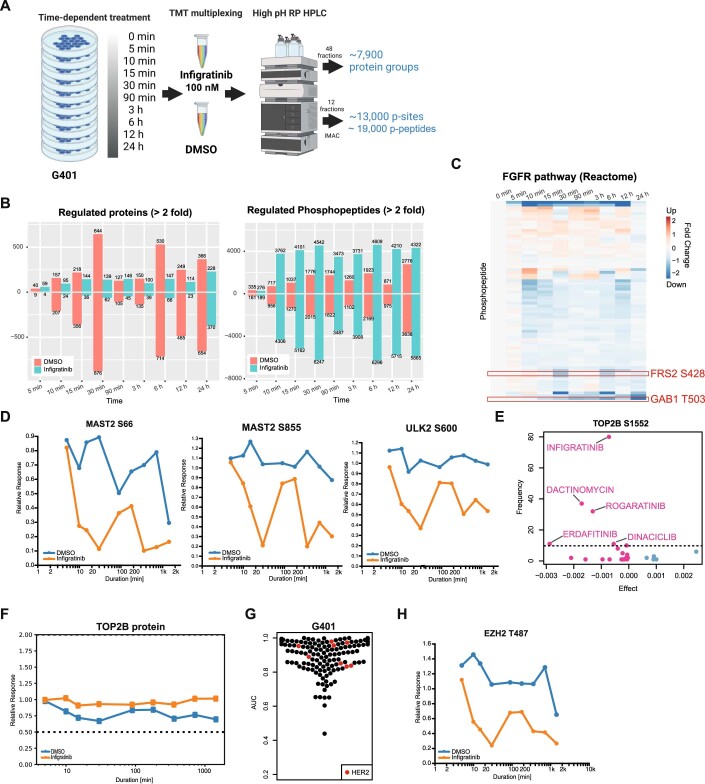
Figure EV6. Time-resolved (phospho)proteomic analysis of G401 cells in response to Infigratinib.
(A) Experimental workflow and number of protein and phosphopeptide identifications/quantification. For each time point of drug treatment, a DMSO control was included to account for abundance changes that are not due to the drug treatment. (B) Number of drug-induced protein expression changes (left panel) and phosphopeptide abundance (at least twofold compared to zero min at different time points). (C) Heatmap of fold-changes of phosphopeptides from proteins involved in FGFR signalling (annotations from Reactome) compared to DMSO at different time points after Infigratinib treatment. (D) Time course of p-sites of MAST2 and ULK2 proteins following Infigratinib treatment. (E) Elastic net regression analysis using the phosphorylation site S1552 of TOP2B to identify drugs associated with this p-site. (F) TOP2B protein level at different time points after Infigratinib treatment. (G) Distribution of AUC values from the phenotypic drug screen in G401 cells (139 kinase inhibitors shown). Inhibitors targeting HER2 are highlighted in red. (H) Time course of EZH2 T487 following Infigratinib treatment.

