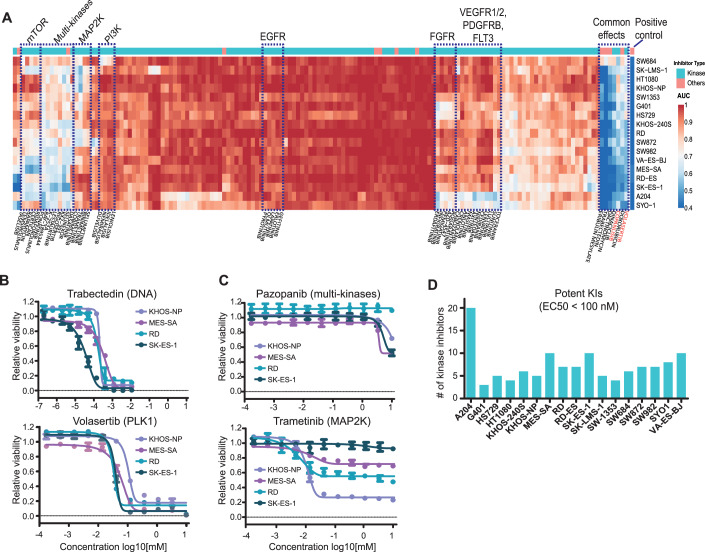
Figure 2. Phenotypic drug screening revealed common and distinct drug responses of sarcoma cell lines.
(A) Heatmap summarising the responses of 17 sarcoma lines (rows) to 150 clinical cancer drugs (columns). Dotted line boxes highlight clusters of drugs representing common targets or effects. AUC area under the curve. (B, C) Examples for cell viability dose–response curves from panel (A). Measurements were in technical triplicates and error bars denote the standard deviation (SD). (D) Numbers of kinase inhibitors that affect the viability of cell lines with EC50 values of smaller than 100 nM (AUCs <0.9 and relative inhibition effect >50%). Source data are available online for this figure.

