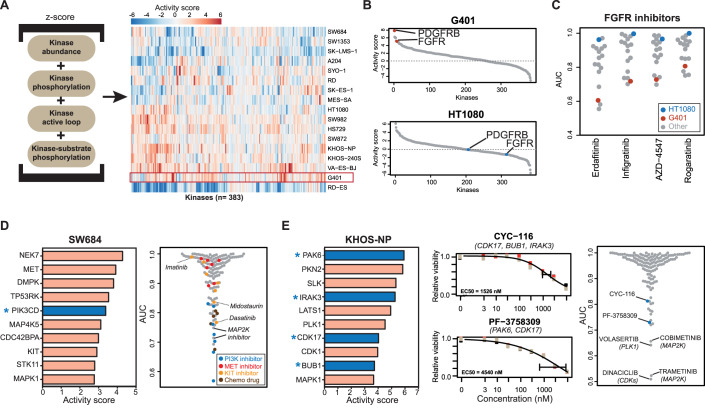
Figure 3. Connecting molecular activity landscapes and drug responses.
(A) Activity landscapes of sarcoma lines (right panel) computed from the proteomic data based on the intensities of the molecular features shown in the left panel (see “Methods” for details). (B) Distribution of activity scores of protein in G401 and HT1080 cells showing differences in activity scores for FGFR and PDGFRB. (C) Relative viability (AUC) of sarcoma cell lines in response to four FGFR inhibitors. (D) Left panel: list of kinases ranked by activity score in SW684 cells. The asterisk denotes a kinase that is a target of the most potent kinase inhibitor. Right panel: relative sensitivity of SW684 cells to all drugs in the screen. (E) Left panel: same as panel (D) but for KHOS-NP cells. Middle panel: dose–response curves for the phase I/II inhibitors CYC-116 and PF-3758309 (the gene names of the targets of the drugs are indicated in parenthesis). Measurements were in technical triplicates and error bars denote the standard deviation (SD). Right panel: relative sensitivity of KHOS-NP cells to all drugs in the screen. Source data are available online for this figure.

