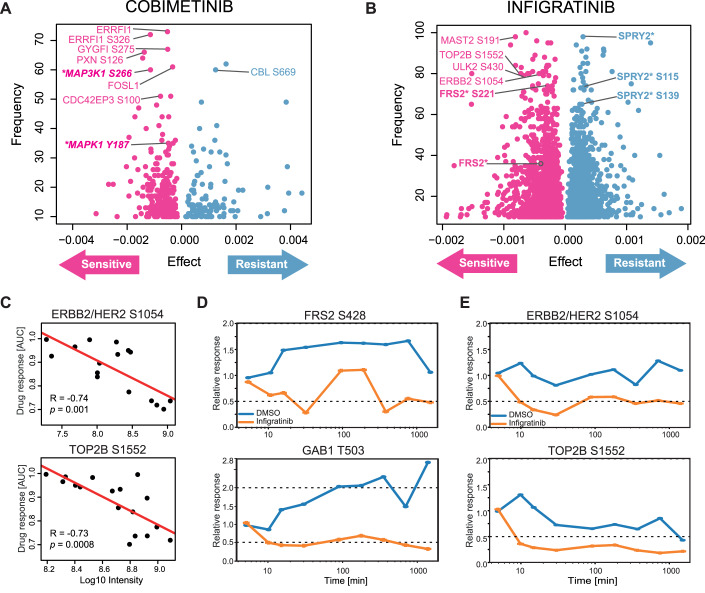
Figure 5. Correlating phenotypes and proteotypes identifies markers of drug response.
(A) Result of elastic net regression for the MAP2K inhibitor Cobimetinib highlighting proteins and phosphorylation sites indicative of drug resistance or sensitivity. (B) Same as panel (A) but for the FGFR inhibitor Infigratinib. (C) Correlation analysis between the level of phenotypic response of cell lines towards Infigratinib and the abundance of ERBB2 S1054 (top panel) and the abundance of TOP2B S1552 (bottom panel). (D) Time-dependent analysis of FRS2 S428 (top panel) and GAB1 T503 (bottom panel) in response to Infigratinib in G401 cells. Both phosphorylation sites are known members of FGFR signalling. (E) Same as panel (D) but for two novel phosphorylation sites ERBB2/HER2 S1054 (top panel) and TOP2B S1552 (bottom panel). Source data are available online for this figure.

