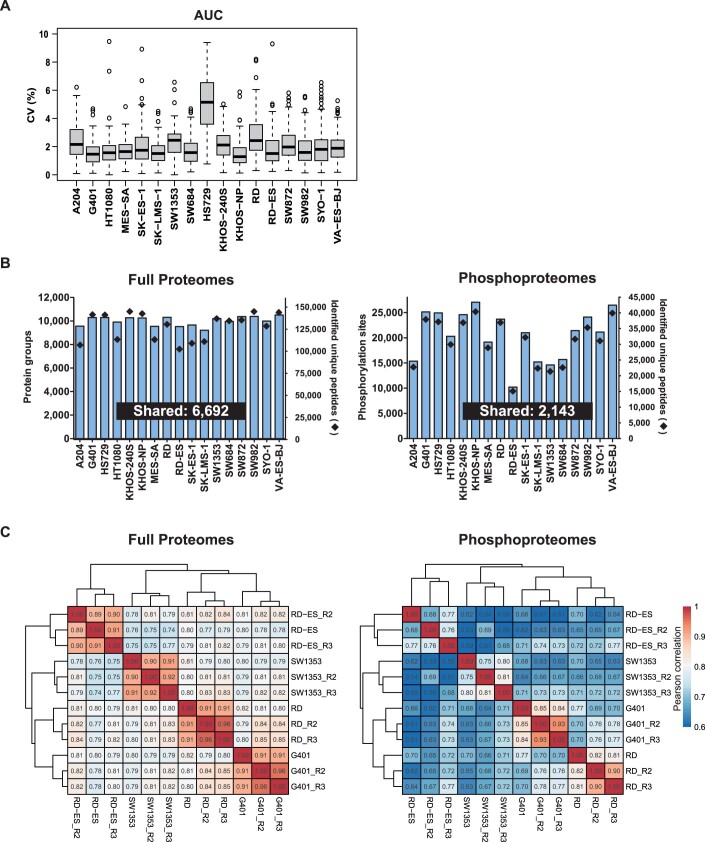
EV Fig. 1. Summary of data quality.
(A) Distributions of coefficient of variation (CV) of AUC (area under the curve) values determined from cell viability assays (n = 3) in response to 150 cancer drugs (each circle represents one drug). The central band represents the median, while the hinges denote the first and third quartiles with whiskers extending up to 1.5 times the interquartile range (IQR). (B) The number of quantified protein groups/peptides (left) and p-sites/phosphorylated peptides (right). (C) Unsupervised hierarchical clustering of biological triplicates of four cell lines on protein (left) and phosphoprotein (right) level. Pearson correlation was shown. R2, R3: biological replicates.

