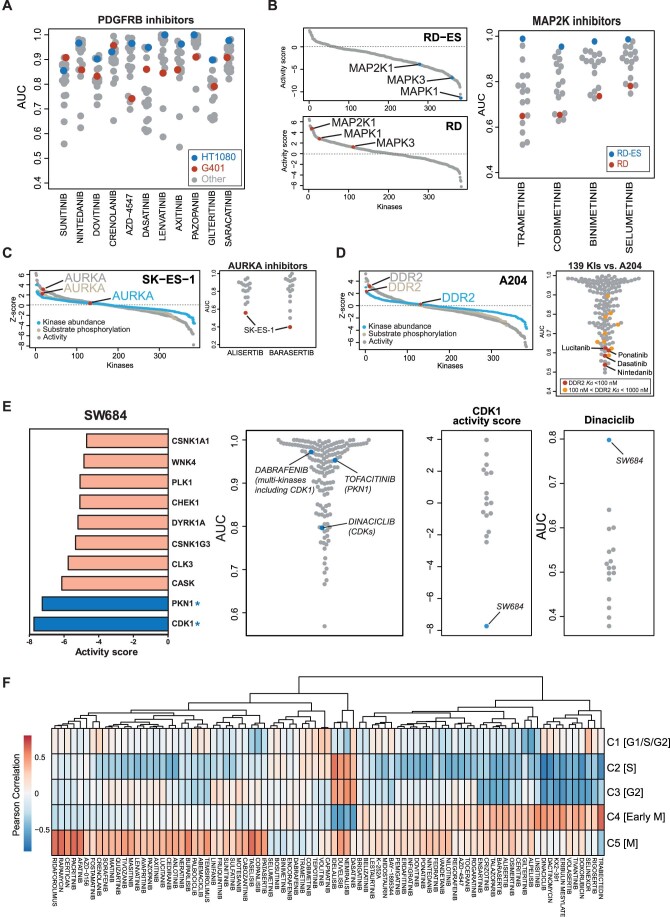
Figure EV3. Integration of phenotypic drug response and proteomic activity scores.
(A) Phenotypic drug response of two sarcoma lines towards 11 PDGFRB inhibitors. (B) Distribution of activity scores of proteins in RD-ES (top panel) and RD cells (bottom panel) showing that MAP2K1 and its downstream substrates MAPK1 and MAPK3 have different activities in the two cell lines. This translates into differences in phenotypic response of the two cell lines to MAP2K inhibitors (right panel). (C) Ranked list of kinases either considering kinase abundance, substrate phosphorylation abundance or computed activity in SK-ES-1 cells (left panel) showing that AURKA phosphorylation and activity is substantially higher than protein abundance. This translates into a strong response of the cell lines to AURKA inhibitors (right panel). (D) Same as panel (C) but for DDR2 in A204 cells. (E) Left panel: list of kinases ranked by activity score in SW684 cells. The asterisk denotes a kinase that is a target of the kinase inhibitor. Middle panel: relative sensitivity of SW684 cells to all drugs in the screen. Right 2 panels: CDK1 activity score and drug responses toward Dinaciclib among 17 sarcoma lines. (F) The heatmap summarises the Pearson correlations of proportions of cell cycle clusters (from Kelly et al) and drug responses from 87 drugs (AUC <0.8).

