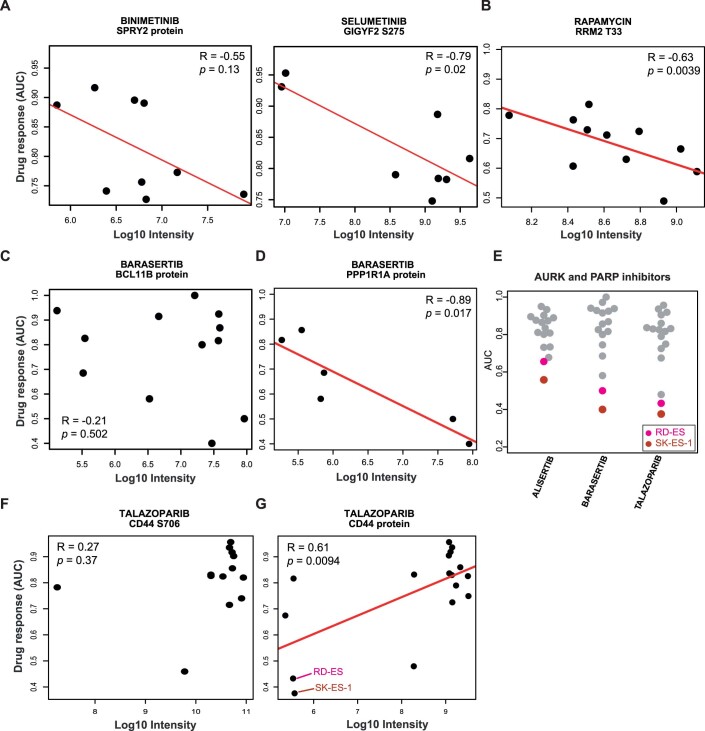
Figure EV4. Examples of correlation analysis of phenotypic drug sensitivity and protein or p-site abundance for drugs forming clusters in sparse multiblock partial least-square regression (SMBPLSR) analysis.
(A) SPRY2 protein levels as a marker for sensitivity towards Binimetinib (left panel) and GIGYF2 S275 phosphorylation abundance as a sensitivity marker for Selumetinib (right panel; both drugs are MAP2K inhibitors). (B–D) Same as panel (A) but for Rapamycin (mTOR inhibitor) and Barasertib (PARP inhibitor). (E) The response of two Ewing sarcoma lines (in red and pink) towards AURK and PARP inhibitors is more pronounced than for all other cell lines. (F, G) Same as panel A but for Talazoparib (PARP inhibitor). Again, the two Ewing sarcoma lines (in red and pink) are the most sensitive to this drug.

