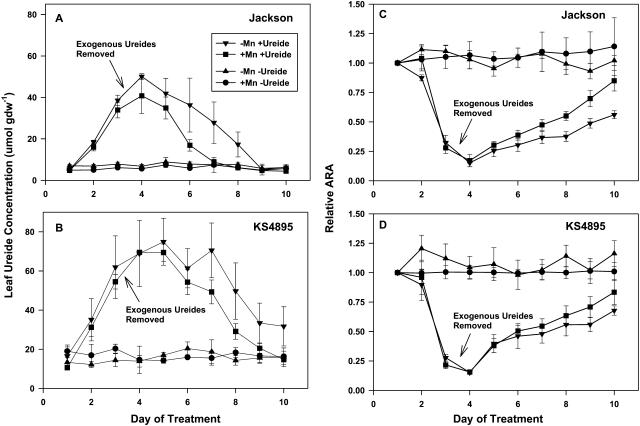
Figure 1.
Ureide concentration in the uppermost expanded trifoliolate leaf and relative ARA in response to Mn fertility and exogenous ureides for Jackson and KS4895, Experiment 1. Values of ARA are expressed relative to the well-watered control for a given day. Bars represent the average se of the mean for a treatment on a given day.

