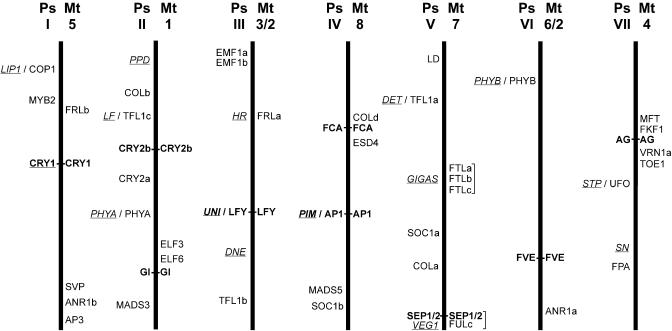
Figure 4.
Approximate map locations of flowering genes in pea and Medicago. This figure represents diagrammatically the syntenic relationships described for pea and Medicago by Kaló et al. (2004) and Choi et al. (2004). The seven pea linkage groups are shown as thick vertical lines, and the corresponding Medicago chromosomes are indicated at the top right of each (Ps, garden pea; Mt, M. truncatula). The approximate map positions of pea genes are indicated on the left and Medicago genes on the right. Pea loci defined by mutants are underlined, and orthologous genes in the two species are shown in bold and joined by a horizontal line. Note that homologous chromosomes are normalized in length, and map positions are therefore relative for each linkage group/chromosome and each species. Actual map positions of Medicago genes are as follows: AG (AC137837; LG4-58.7), ANR1a (AC123898; LG2-1.5), ANR1b (AC126010 and TC82622; LG5-15), AP1 (AC144726; LG8-49.5), AP3 (AC136451 and TC90653; LG5-5.2), COLd (AC127169 and AW693899 and TC88293; LG8-68-70.9), CRY2b (AC122171; LG1-18.1), ELF3 (AC122168 and TC83932; LG1-51.8), ELF6 (AC133709 and BF644901; LG1-54.8), ESD4 (AC147012 and TC79449; LG8-64.2-68), FCA (AC135100 and BG449291; LG8-68), FKF1 (AC140104 and AW684990; LG4-61.6), FRLa (AC121232; LG3-37.9), FRLb (AC137079; LG5-78.1-80.3), FTLa (AC123593a; LG7-50.6), FTLb (AC123593b; LG7-50.6), FTLc (AC123593c; LG7-50.6), FULc (AC146650b and AL387855; LG7-5.1), FVE (AC121243 and TC87417 and TC91602; LG2-19.3), GI (AC148397 and TC85289; LG1-58.5), LFY (AC139708; LG3-85), MFT (AC139526 and TC81061; LG4-62.4), SEP1/2 (AC146650a; LG7-5.1), SVP (AC135848 and TC87621; LG5-16.4), TOE1 (AC145164 and TC88593; LG4-46.9), VRN1a (AC137825 and TC78901; LG4-51.4).

