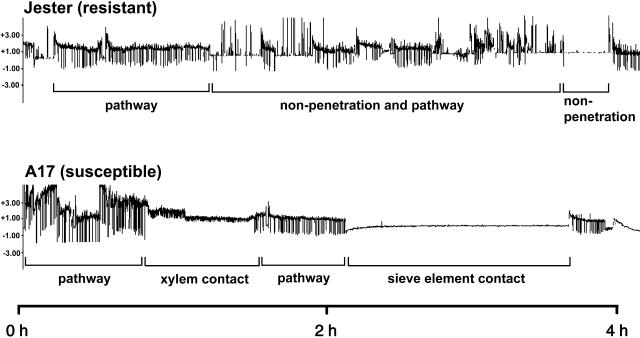
Figure 2.
EPG showing representative waveform patterns produced when A. kondoi apterae feed on resistant line Jester (top) or susceptible line A17 (bottom). Plants used for these traces had not been preinfested with A. kondoi. The horizontal axis represents a 4-h time period; the vertical axes represent voltage. Histological studies of plant-aphid interactions have correlated stylet positions in plant tissues with specific EPG waveforms (Walker, 2000). “Sieve element contact,” consisting primarily of sap ingestion with short periods of salivation into sieve elements, was frequently seen with plants of A17 and only rarely seen with plants of Jester. “Pathway” indicates mostly intramural probing activities between mesophyll or parenchyma cells. Sharp, downward spikes indicate cell puncture events by stylets, each lasting approximately 5 s. “Xylem contact” indicates stylet penetration of tracheary elements. “Nonpenetration” indicates stylets are outside the plant.

