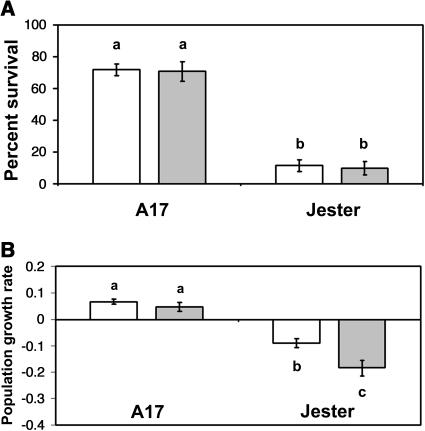
Figure 3.
Effects of plant genotype and prior infestation on A. kondoi survival (A) and population growth rate (B). White bars, no prior infestation; gray bars, prior infestation. Population growth rate in B was measured as (log[mg]aphid−1) d−1. Bars represent means of 14 replicates. Error bars represent ±1 se. Means labeled with the same letter are not significantly different (P < 0.05).

