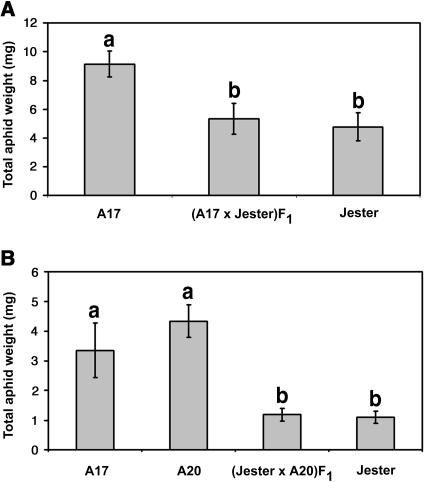
Figure 5.
Performance of A. kondoi on F1 and parent plants from the cross A17 × Jester (A) and Jester × A20 (B). A and B show results of two separate experiments in which different numbers of aphids were used for different lengths of time (see “Materials and Methods”). In A, bars represent means of 10 to 12 replicate plants; in B, bars represent means of 7 to 9 plants. Error bars are ±1 se. Means labeled with the same letter are not significantly different (P < 0.01).

