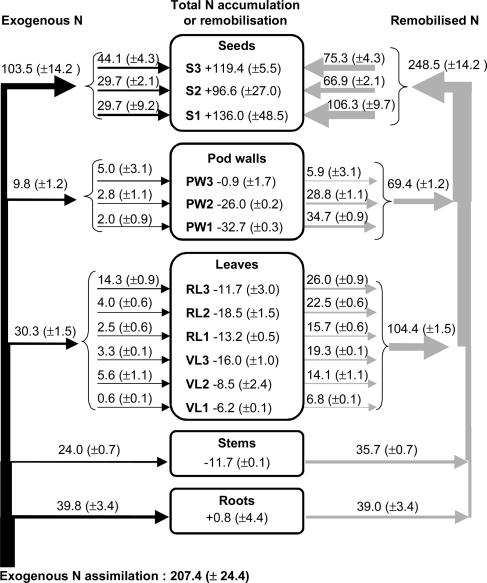
Figure 3.
Allocation of exogenous N (left arrows) calculated using 15N enrichment (see “Materials and Methods,” Eq. 3) and distribution of endogenous remobilized N (right arrows) from vegetative parts (see “Materials and Methods,” Eq. 4) to seeds during the filling period of the first two reproductive nodes of pea plants (from 945–1,260°C DAS). Values inside the different compartments represent the N accumulation (+) or remobilization (−) in/from a stratum of compartment (see “Materials and Methods,” Eq. 2). Nitrogen fluxes are expressed in mg plant−1; each value is given as the mean ± se for n = 3 repetitions of each of two plants, and the width of arrows is proportional to the N fluxes.

