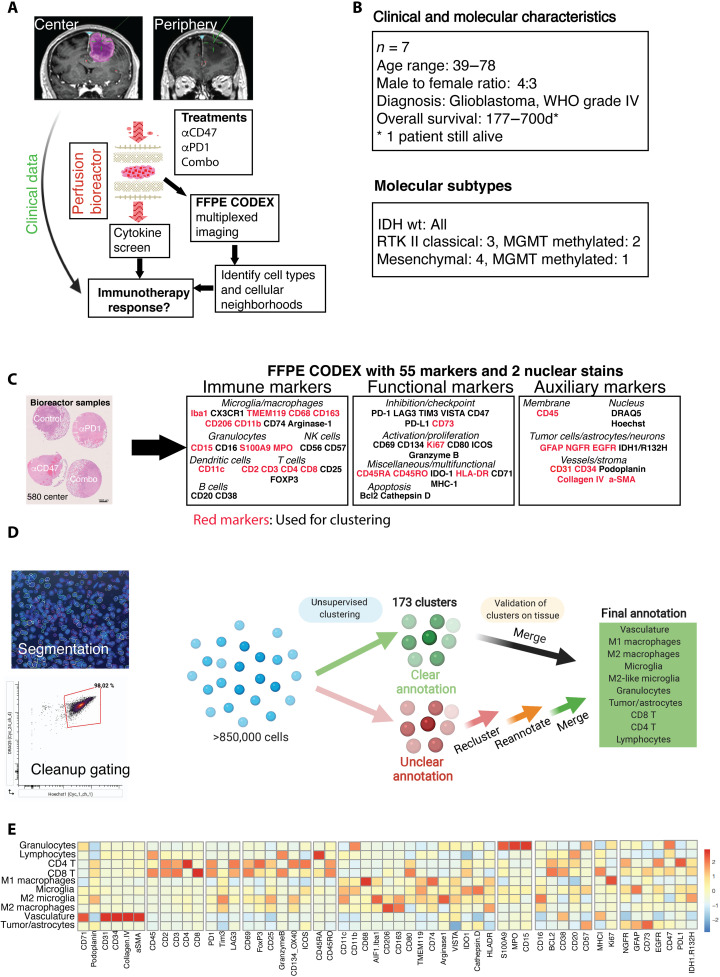
Fig. 1. Experimental setup, clinical characteristics, and CODEX clustering pipeline.
(A) Experimental setup of the proof-of-concept study: Fresh tumor biopsies were taken according to neuronavigation and directly transferred into 3D perfusion bioreactors. Immunomodulatory treatments consisted of innate (anti-CD47) and/or adaptive (anti–PD-1) immune checkpoint inhibition for 7 days. Soluble proteins and metabolites from bioreactor media, and multidimensional CODEX microscopy data were integrated to assess immunotherapy response per patient/tumor region sample. (B) Clinical baseline and genetic data of the included patients (n = 7). (C) Left: Representative arrangement of an FFPE-processed, hematoxylin and eosin (H&E)–stained center biopsy consisting of explants cultured in the bioreactor and treated with different immunotherapies. Scale bar, 1000 μm. Right: FFPE CODEX antibody panel. (D) Clustering strategy for cell type annotation. Cells were segmented on the basis of nuclear DRAQ5 staining, and DRAQ5/Hoechst double-positive cells were gated in CellEngine (bottom left), resulting in >850,000 single cells across all samples. Vortex clustering at first using the markers specified led to 173 clusters, which were subsequently merged/simplified on the basis of manual validation on the tissue. Unclear cells were reclustered, reannotated, and revalidated on each tissue section using the cell finder package. Last, 10 main cell types throughout all samples could be annotated with high confidence (see fig. S3, detailed clustering strategy, cell passports, and flow cytometry–like plots). (E) Heatmap of mean fluorescence intensities of individual markers used in the CODEX pipeline per annotated cell type across all samples.

