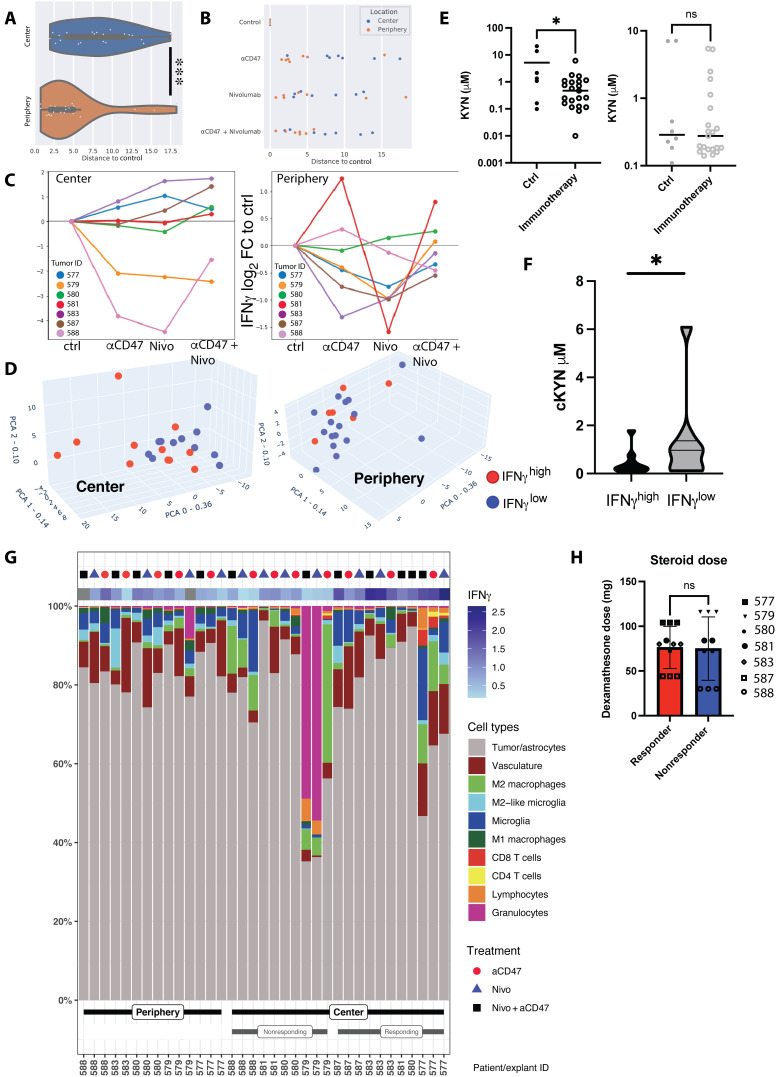
Fig. 5. Stratification based on IFNγ levels in culture media reveals a subset of tumor center explants responding to immunotherapy.
(A) Global soluble protein analysis of bioreactor media in relation to their reference (control samples). Distances to control correspond to Euclidean distances between sample and the corresponding control on the first two components of the PCA of global cytokine response—36% and 14% of the total variance, respectively. (B) Relative distance to control of global soluble protein expression values among immunotherapy-treated center and periphery explants. (C) Log2 fold change of IFNγ secretion versus control in center and periphery, per individual patient, condition, and biopsy location. Samples with a treated/control ratio of >1 were counted as IFNγhigh, independent of the applied treatment regimen. (D) 3D PCA of global cytokine response in the center (left) and periphery (right) samples, overlaid with information on IFNγ secretion. Red dots, IFNγhigh; blue dots, IFNγlow. For individual PC weights, see fig. S9. (E) Measurement of kynurenine (KYN) levels in bioreactor supernatants after local immunomodulatory treatments depending on biopsy location. The left graph represents center biopsies, and the right graph represents periphery biopsies. For individual measurements per treatment modality, refer to fig. S11. (F) Pooled KYN values among immunotherapy-treated IFNγhigh responder and IFNγlow nonresponder explants (Student’s t test). (G) Cellular composition (as percentage of total cell count per explant) of individual treated explants stratified according to periphery, IFNγlow center, and IFNγhigh center. IFNγ values represent log2 fold change to untreated control explant. (H) Cumulative pre- and intrasurgical steroid doses (dexamethasone) in responding and nonresponding center explants. Statistics: (A) Mann-Whitney U test, (E) two-tailed Welch’s test, (F and H) Student’s t test. *P < 0.05, **P < 0.01, and ***P < 0.005.

