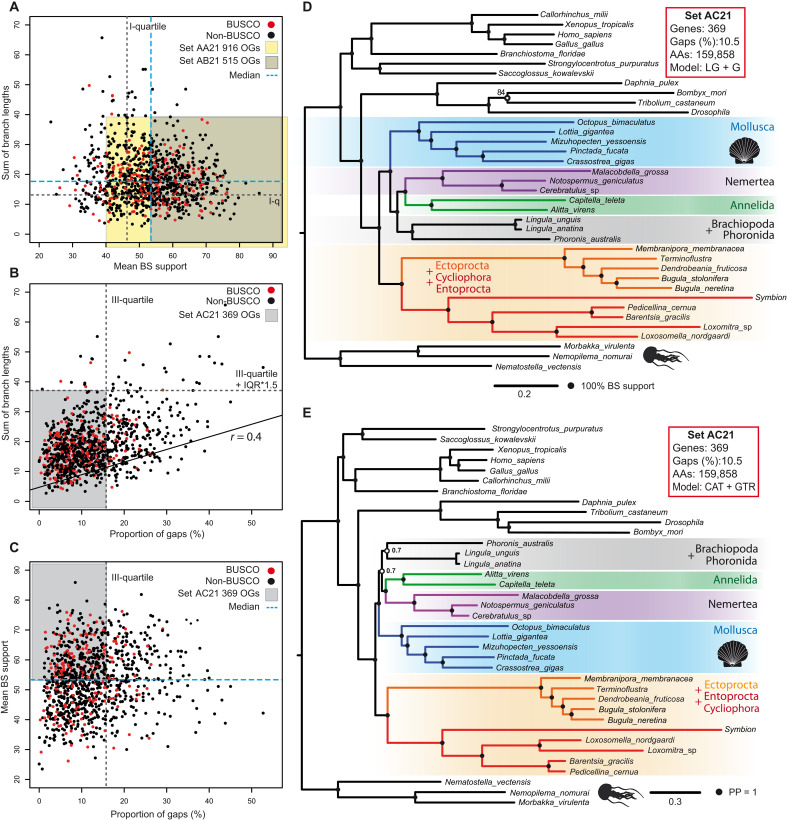
Fig. 3. Parameter distributions of the dataset S21 and the phylogenetic trees based on 369 protein markers.
(A to C) Partitioning of S21 set based on (A) the branch lengths, (B) the mean BS, and (C) percentage of gaps in individual gene trees. Red dots denote genes that belong to BUSCO category, and black dots correspond to all remaining proteins. Position of the median values and selected quartile values are shown by dashed lines. IQR, interquartile range. (D) ML tree based on concatenation of 369 protein markers (set AC21). LG + G substitution model, 159,858 distinct alignment patterns, and all branches except one marked with open circle have maximum BS. (E) BI based on concatenation of 369 protein markers (set AC21). CAT + GTR + G substitution model and all branches except those marked with open circles have maximum support.

