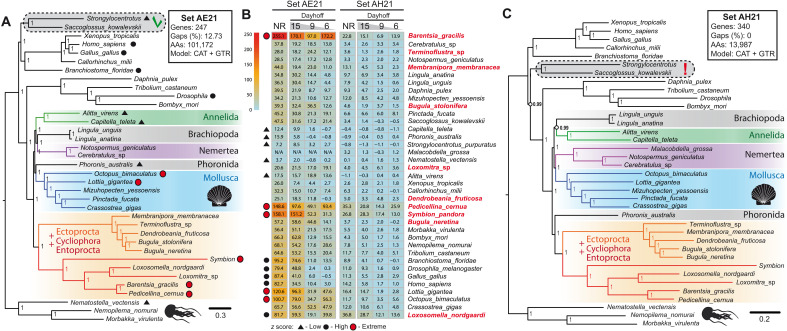
Fig. 4. Bayesian analysis and the assessment of compositional heterogeneity.
(A) BI based on concatenation of 247 protein markers from BUSCO set (AE21). Consensus tree derived from nonrecoded matrix is shown. CAT + GTR + G substitution model, 101,172 distinct alignment positions, 12.7% of gaps and undetermined characters, and all branches have maximum support. (B) Results of PPA for nonrecoded (NR) and recoded matrices of the sets AE21 (left) and AH21 (right). The z scores are listed for all species and recoding schemes: 6 (Dayhof-6), 9 (Dayhoff-9), and 15 (Dayhoff-15). Species with low, high, and extreme z scores are marked with black triangles, black circles, and red circles, respectively. (C) BI based on concatenation of 340 protein markers (set AH21). Consensus tree derived from nonrecoded matrix is shown. CAT + GTR + G substitution model, 13,987 distinct alignment positions, 0% of gaps, and all branches except those marked by open circles have maximum support.

