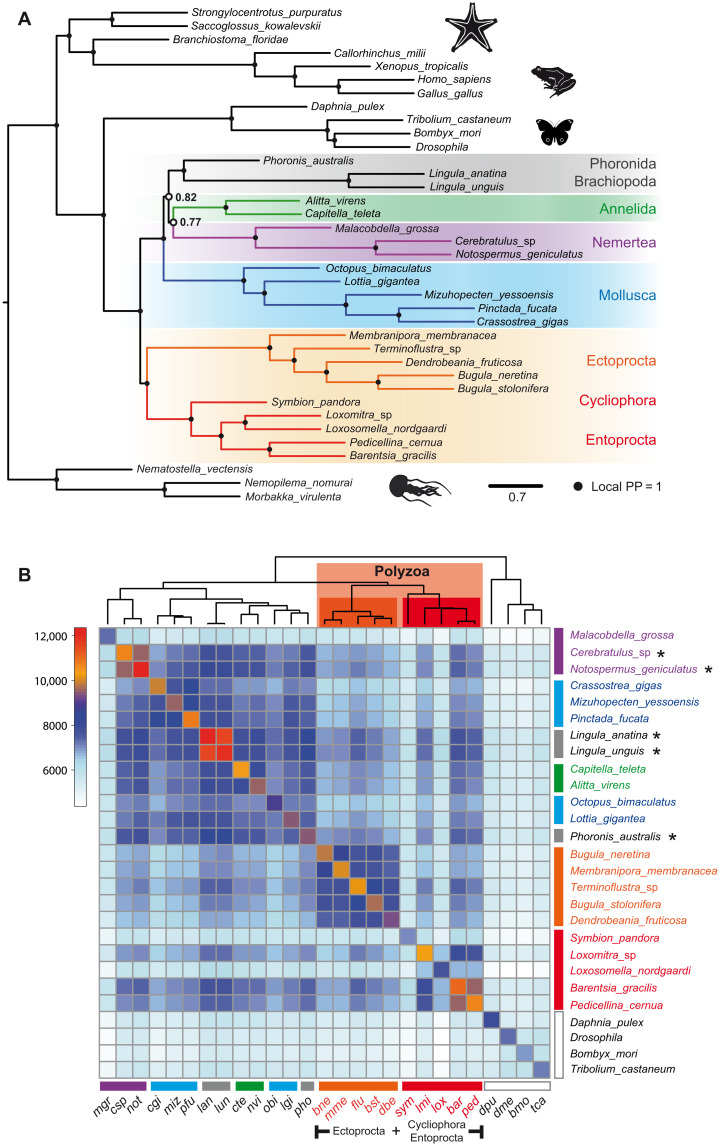
Fig. 5. Coalescence analysis and the distribution of shared orthologs among lophotrochozoan lineages.
(A) The consensus tree of coalescence analysis based on 1036 orthologs present in all 37 species. Branches with a BS of ≤10% were collapsed in individual gene trees before consensus tree calculation. All nodes except those marked with open circles have a local PP of ~1. (B) The heatmap represents the number of OGs that are shared among the representatives of Lophotrochozoa and Ecdysozoa used as outgroup. Number of shared OGs is coded with a color gradient bar shown on the left side of the figure. Species were clustered on the basis of the similarities of their gene sets. Result of the clustering is represented by a cladogram on the top of the heatmap. Representatives of Ectoprocta, Entoprocta, and Symbion (Cycliophora) form a distinct clade. This group of taxa in marked collectively with orange and red polygons and with “Polyzoa” tag. Asterisks mark the species with the highest number of shared OGs to the representatives of Ectoprocta and Entoprocta.

