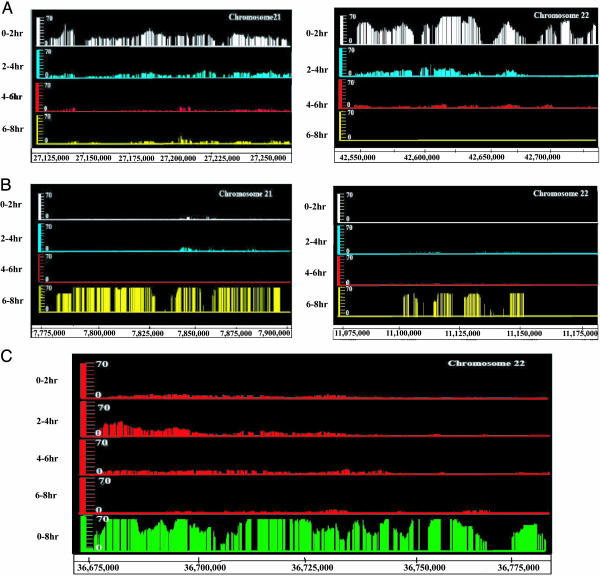
Fig. 3.
Genomic replication profile. (A) Comparative replication profiles of two early replicating segments on chromosomes 21 and 22. Each line shows the significant enrichment of replication signal in the indicated 2-hr interval relative to the 0-8 hr interval. (B) Profile of two late replicating segments at the telomeric ends of the p arms of the two chromosomes as in A.(C) Examples of segments that replicate in all quarters of S phase without significant enrichment of signal in any one quarter. The top four lines are the same as in A. The green bars in the bottom line indicate P values for replication with the 0-8 hr labeled probe indicating that replication of the entire segment was detected easily. The probability that significant replication was detected in all time intervals over this stretch is shown in Fig. 7. Another example of pan-S phase replication is shown in Fig. 6, box A.

