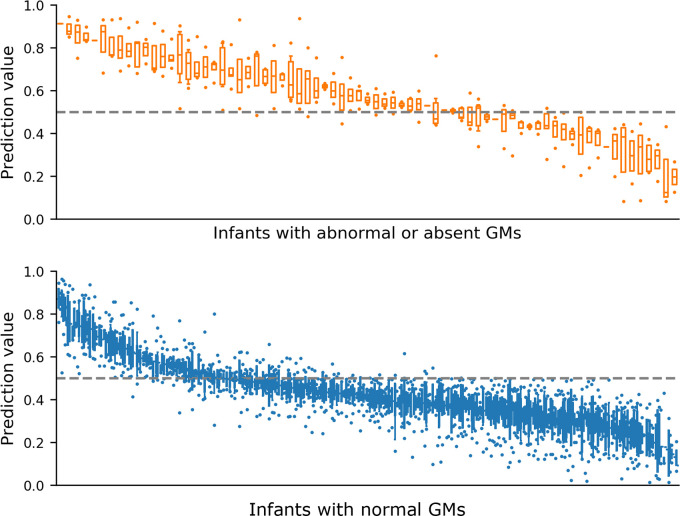
Fig 3. Variation in GMs prediction values from 25-fold cross validation.
Prediction values reported when infant movement included in held out test set, ordered by median prediction value. Top (orange) infant videos scored as abnormal or absent GMs by expert rater, n = 73 infant videos. Bottom (blue) infant videos scored as normal GMs by expert rater, n = 396 infant videos. Boxes with horizontal line represent interquartile range and median respectively, error bars represent 95% confidence interval and dots represent outliers. Dashed line at 0.5 represents cut-off value for classifier between prediction categories.

