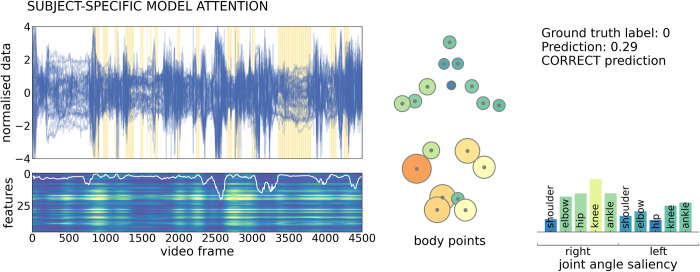
Fig 4. Example of subject specific model attention to input features.
Feature timeseries (top) and saliency map (bottom) for a single, correctly-classified video from an infant with normal GMs. Timeseries are shown for each feature (n = 46), across the length of the video. Yellow bars indicate clips with high model attention (75th percentile across all subjects). Saliency was calculated for each feature in each frame and summed over frames within each clip (n = 547 clips). The map has been upsampled and smoothed to match the length of the timeseries (frames = 4500). Lighter colours indicate higher saliency (arbitrary unit). Clip attention derived from the attention module (upsampled and smoothed) is overlaid in white. Average saliency across the full video is shown for each body point (middle) and joint angle (right). Lighter colours and larger size reflect higher saliency. The model prediction is shown top right, where 0 indicates normal GMs prediction.

