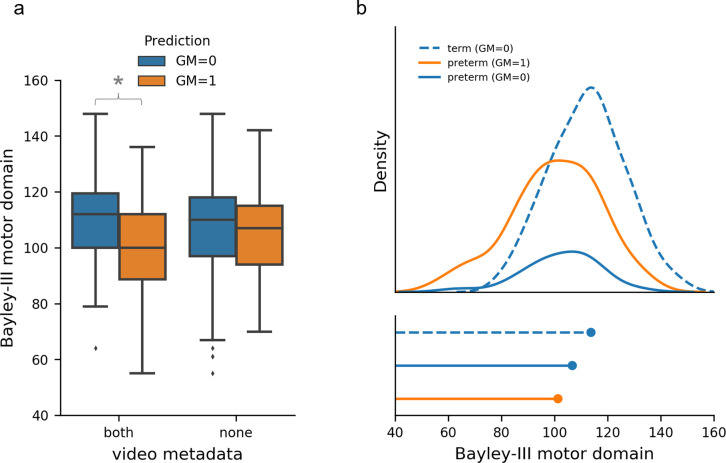
Fig 6. GMs prediction and motor development at 2 years.
A. Bayley-III motor outcome stratified by GMs prediction (n = 252 infant videos) and model variants trained using video movement and metadata (both = age at acquisition and birth cohort) and movement data alone (none). Blue indicates GMs prediction = 0 (normal) and orange indicates GMs prediction = 1 (abnormal/absent) for all graphs. * Indicates strong evidence for differences between GMs classification prediction from independent two-sample t-test. B. Top, density function of motor outcome by birth cohort and GMs prediction. Bottom, Peak of density function. Term infants are represented by dashed lines and preterm infants by solid lines.

