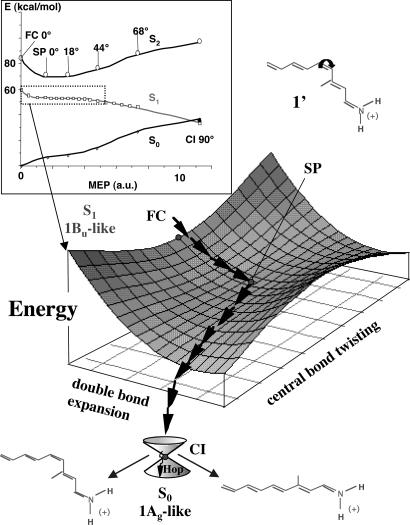
Fig. 1.
The Inset displays the energy profiles along the photoisomerization minimum energy path (MEP) computed on the S1 (1Bu-like) energy surface for the PSB11 model in vacuo (1′) (see ref. 6). A schematic illustration of the bimodal reaction coordinate (stream of arrows) along the MEP in the dotted box is reported below. Point SP corresponds to a flat planar stationary point on S1, where the torsional deformation (leading to the TICT S1/S0 CI) begins.

