Fig. 5.
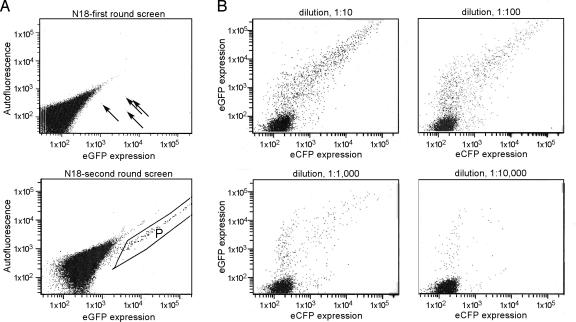
FACS analysis of transfected CHO cells. (A) First- and second-round enrichment of plasmids containing random N18 sequences in the ICS of the positive feedback vector (4XUAS/R/N18/Gal4). A library of constructs was transfected into CHO cells and first-round FACS was performed 3 days after transfection. DNA was extracted from recovered cells and amplified by PCR. The PCR products were digested and cloned into the same vector for a second round of cell sorting. Both sorting graphs show a total of 100,000 cells from the transfected CHO cells pool. (Lower) The area labeled “P” shows an enrichment of positive cells. The ordinate axis indicates the expression of EGFP. The abscissa is a measure of autofluorescence. In both cases, the units are arbitrary. Four positive cells are indicated with arrows. (B) Determining the approximate number of plasmids per transiently transfected cell. Two reporter constructs encoding EGFP and ECFP were mixed (1:1) and transfected into CHO cells with a neutral plasmid (pBluescript-KSII). The reporter constructs were diluted at 1:10, 1:100, 1:1,000, and 1:10,000 concentrations with the pBluescript plasmid. FACS profiles were taken 2 days after transfection. The ordinate axis indicates the expression of ECFP, and the abscissa indicates the expression of EGFP.

