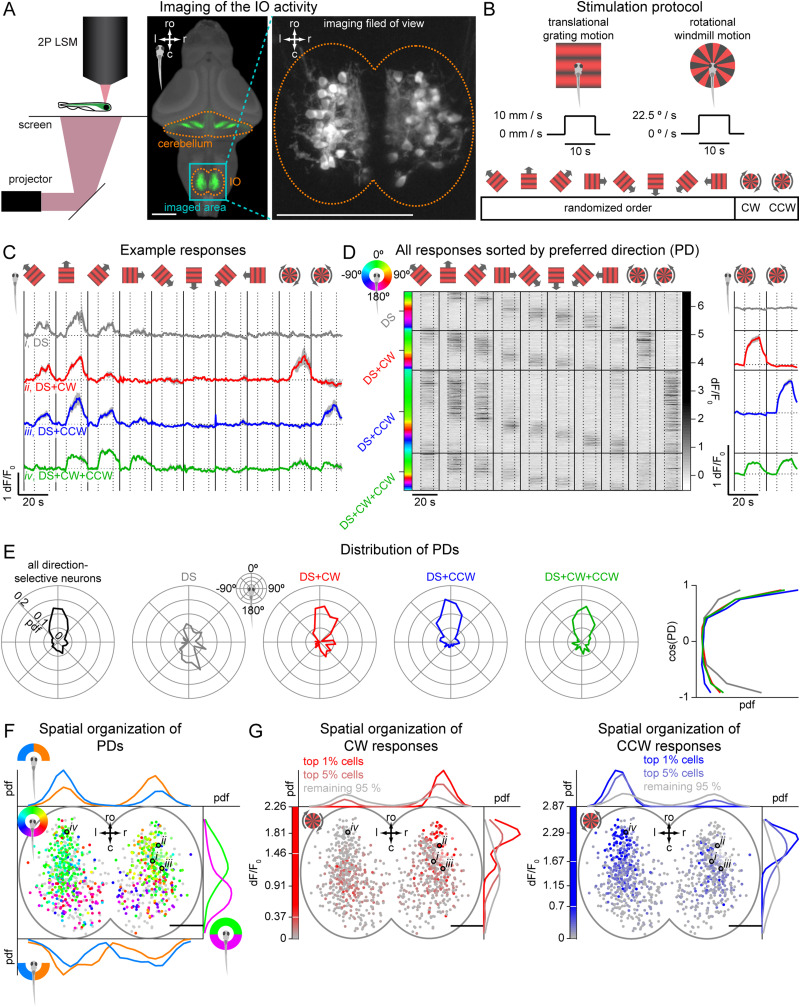
Figure 2.
The majority of IO neurons are sensitive to translational and rotational motion, direction-selective and spatially organized. A, Left, two-photon laser-scanning microscope (2P LSM) used for calcium imaging. Middle, same as Figure 1A; ro, rostral direction; l, left; r, right; c, caudal; scale bars, 100 µm. Teal rectangle outlines the imaged area. Right, maximum intensity z-projection of the anatomy stack from an example fish, showing a typical imaging field of view with individual IO neurons. B, Stimulation protocol. Fish were presented with translational and rotational motion, with each stimulus lasting 21.4 s (6 s stationary, 10 s moving, 5.4 s stationary). Translational gratings moved at 10 mm/s and rotational windmill at 22.5 °/s. For each imaging plane, we presented translational gratings in 8 different directions in a randomized order, followed by clockwise (CW) and counter-clockwise (CCW) rotational motion. C, Average responses of four forward-selective example neurons to translational and rotational motion. DS, direction-selective neurons responding exclusively to translation motion, DS + CW or DS + CCW, direction-selective neurons that also responded to CW or CCW rotation, DS + CW + CCW, direction-selective neurons that also responded to rotation in both directions. Shadows represent SEM across repetitions. Horizontal dotted lines represent each neuron baseline. In C and D, vertical dotted lines separate stationary and moving periods of the stimulus, vertical solid lines separate visual stimuli. D, Left, raster plot for all direction-selective neurons (N = 608 neurons from 12 fish), grouped by response types and sorted by PD (coded by the circular color wheel). Each row represents a neuron’s average response to the ten stimuli shown on top. Right, average response of all neurons in each group to CW and CCW stimuli. Shadows represent SEM across neurons. E, Left, distribution of PDs of all direction-selective neurons and of the 4 different groups of neurons independently. 0° represents forward, 90° rightward, 180° backward and −90° leftward directions. Right, probability distribution of the cosine of PD for each of the four groups. F, Spatial distribution of PDs within the IO (N = 967 active neurons, including 608 direction-selective ones, from 12 fish). Each dot represents a neuron color-coded for PD as represented in the color wheel, or gray for not direction-selective neurons. Small italic roman numbers indicate the location of neurons shown in C. In F and G: ro, rostral direction; l, left; r, right; c, caudal; scale bars, 25 µm. Green and magenta curves show the rostral–caudal distribution of forward- and backward-preferring neurons respectively, separated according to the sign of the PD cosine. Blue and orange curves show the left-right distribution of left- and right-preferring neurons respectively, separated into forward-preferring (top) and backward-preferring (bottom) groups. G, Spatial distribution of rotation sensitivity within the IO. Each dot represents a neuron color-coded for its response to CW (red) and CCW (blue) stimuli. White lines on the color bars denote 99th and 95th percentiles, used for presenting the spatial distributions of top 1%, top 5%, and remaining 95% active neurons.

