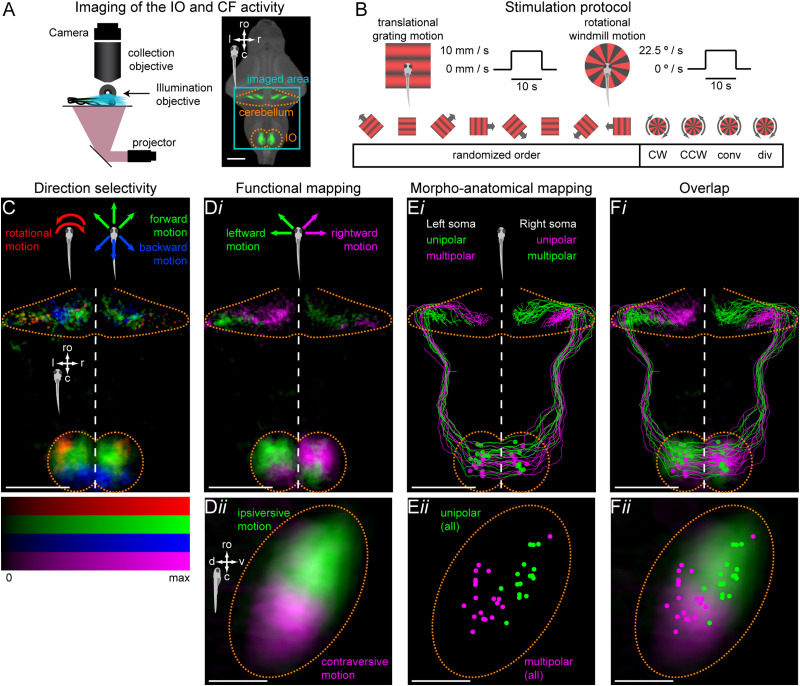
Figure 4.
Functional organization of the IO maps onto its morpho-anatomical organization. A, Left, light-sheet microscope used for fast volumetric calcium imaging. Right, same as Figure 1A. Teal rectangle outlines the imaged area. B, Stimulation protocol. The trial structure was the same as in the binocular stimulation experiment [translational gratings in 8 different directions in a randomized order, followed by clockwise (CW) and counter-clockwise (CCW) rotational motion]. Additionally, we included converging (conv) and diverging (div) rotational motion. Each stimulus lasted 21 s (6 s stationary, 10 s moving, 5 s stationary). Translational gratings moved at 10 mm/s and rotational windmill at 22.5 °/s. For each fish, we presented this stimulus set five times. C, Max z-projection of the distribution of active voxels categorized as forward selective (green), backward selective (blue) or rotation selective (red), averaged across fish. D i, Max z-projections of the distribution of active voxels categorized as left selective (green) or right selective (magenta) in the entire imaging field of view. D ii, Max lateral projection of the distribution of active voxels selective for ipsiversive motion (green) and for contraversive motion (magenta) within the IO. E i, Max z-projection patterns of unipolar and multipolar neurons from Figure 1F, color-coded depending on their morphological type and left-right location within the IO. E ii, Lateral projection of the location of unipolar (green) and multipolar neurons (magenta) within the IO. F, Overlay of D and E. Note that the distribution of active voxels in the IO in the light-sheet imaging data includes signals not only from cell somata but also from surrounding neuropil, which accounts for the more lateral spread compared to the soma distribution. See Table 1 for quantification of the overlap. N = 28 fish; ro, rostral direction; l, left; r, right; c, caudal; v, ventral; d, dorsal; scale bars, 100 µm.

