Figure 3.
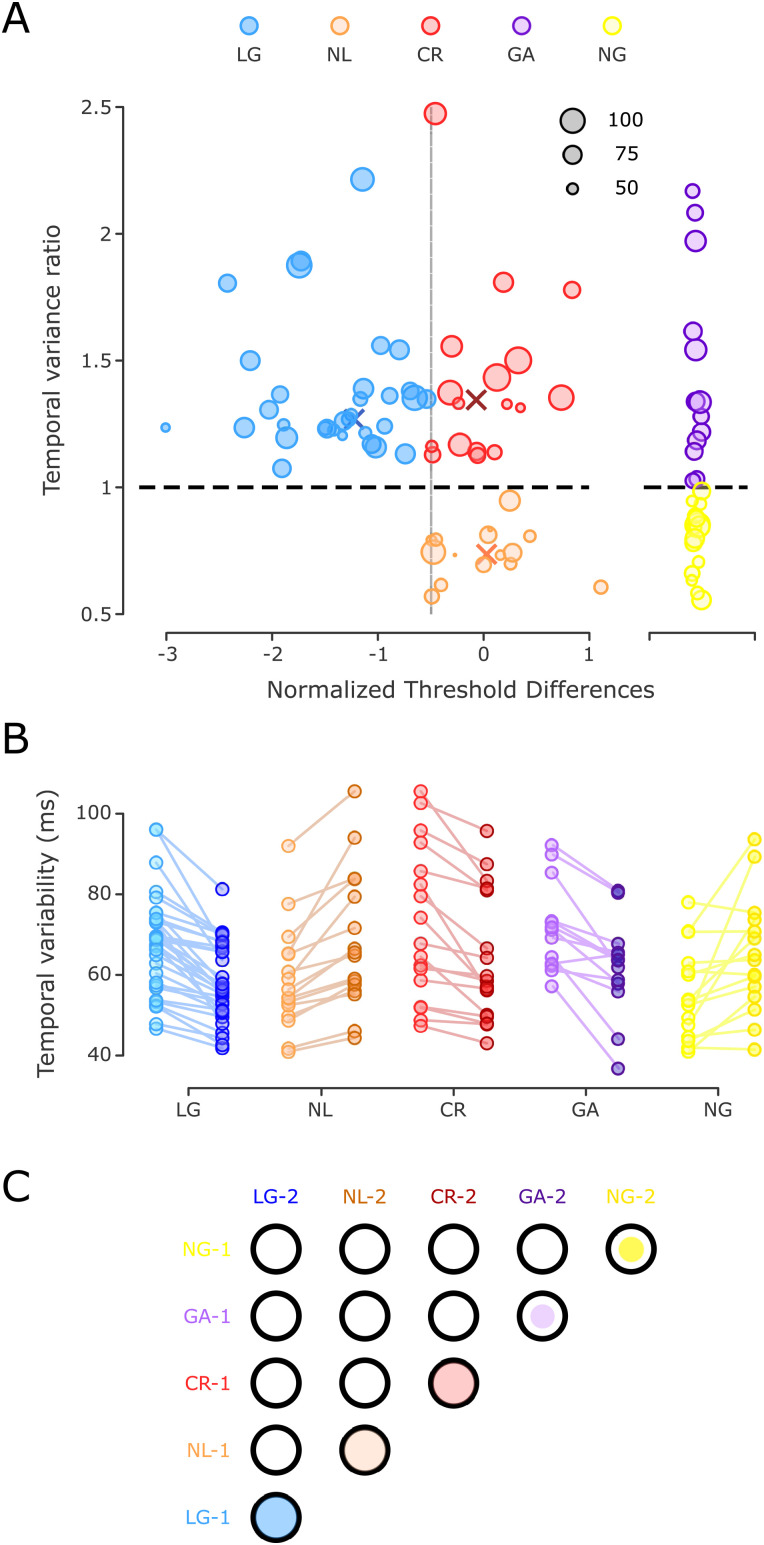
Temporal variability in the SCT and clustering of subjects. A, Left, A K-means cluster classification identified three groups, plotting the TVR as a function of the normalized threshold differences. Blue, orange, and red dots correspond to learners with generalization, NL, and CR learners, respectively. The diameter of the circles was determined by the initial inter-tap variability (in ms). The higher the variability, the bigger the circle (black circles serve as a size guide). The horizontal black dotted line corresponds to a TVR of 1 (no IDT learning). Colored X symbols mark the centroid assigned to each group. Right, Two groups of control subjects were identified: a group with a significant decrease in temporal variability in the post-training SCT session, GA (n = 13, purple circles), and another with no changes in temporal variability between sessions, called NG (n = 15, yellow circles). B, Temporal variability during the pre- and post-training SCT across subjects. Changes in temporal precision are depicted for the five groups using the color code in A with light color for pre-training and dark color for post-training. C, Matrix of statistical differences between groups. Each element of the matrix corresponds to the pairwise comparison between the five groups for the pre-training (1) and post-training (2) sessions in the SCT. Notation as in Figure 3D.

