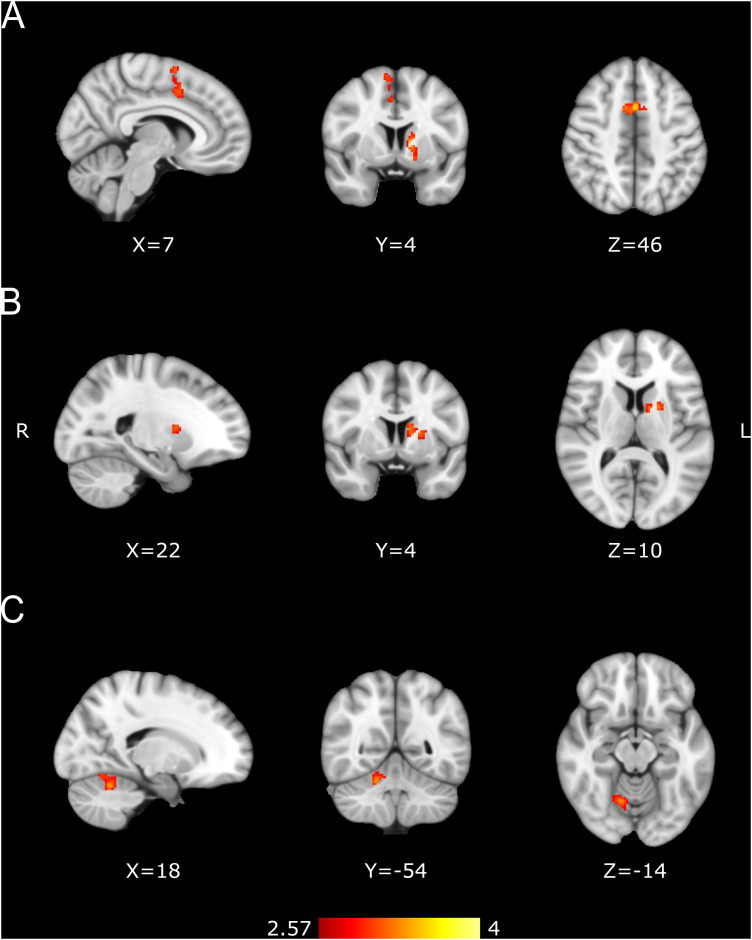
Figure 8.
Functional changes between pre- and post-training identified with mixed model analyses. A, LG group post-training > pre-training. Contrast map for 32 subjects. B, CR group post-training > pre-training. Contrast map for 17 subjects. C, NL group pre-training > post-training. Contrast map for 16 subjects. BOLD changes seen during the continuation epoch. Activation maps are displayed as Z scores with a threshold of p < 0.005, cluster-level FWE p < 0.05, overlaid on the MNI template.

