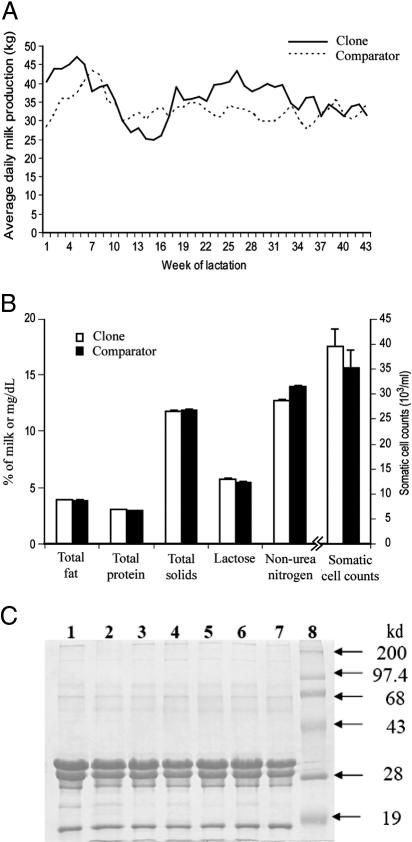
Fig. 2.
Analyses of milk production and compositions of somatic clones and matched comparator cows. (A) Representative first lactation curves of a clone and a comparator cow. (B) Milk total protein (percentage), total fat (percentage), lactose (percentage), total solids (percentage), milk urea nitrogen (mg/dl) and somatic cell count (× 103/ml). (C) A representative image of protein profile analysis of milk samples from clones (lanes 1-3) and comparator cows (lanes 4-7) by SDS/PAGE. Lane 8, molecular mass markers. The four major bands are (from top to bottom identified on the basis on their molecular mass): α-caseins, β-caseins, κ-caseins, and β-lactoglobulins.

