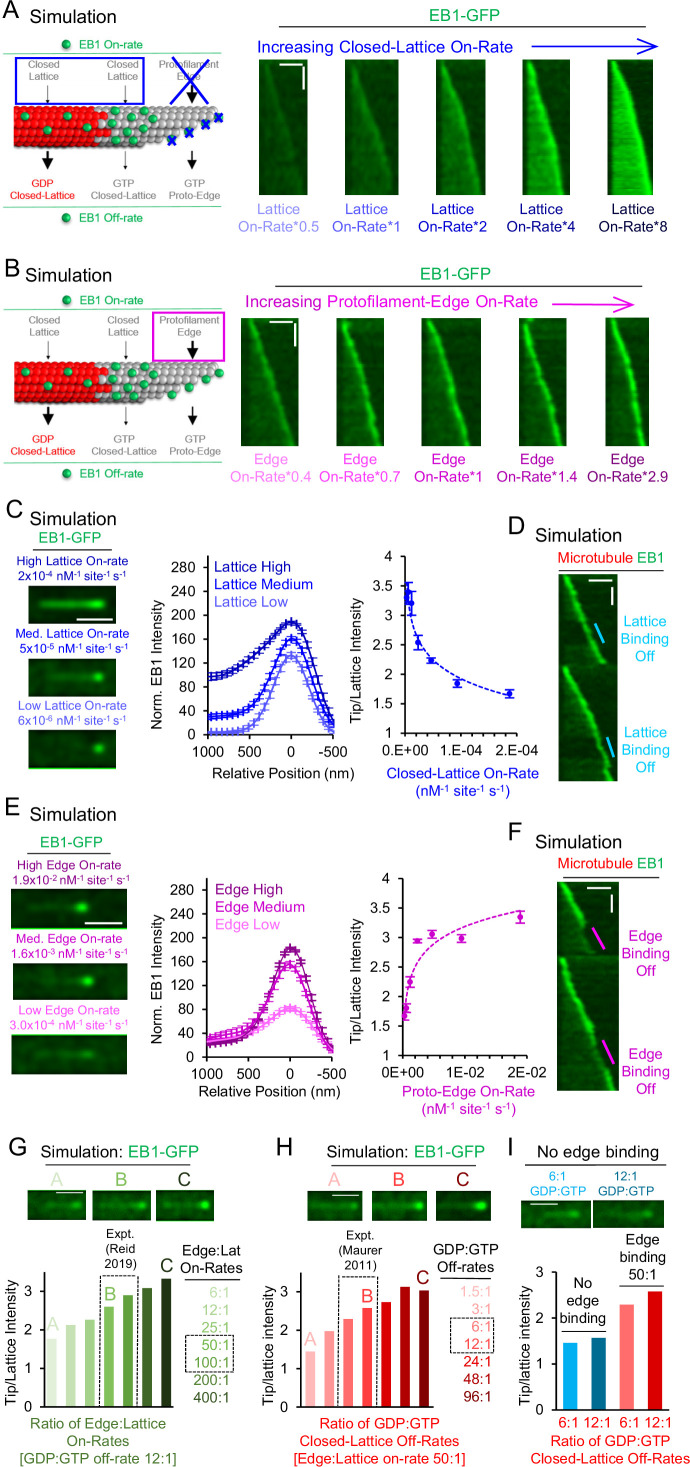
Figure 2. Simulations predict that protofilament-edge binding facilitates robust EB1 tip tracking.
(A) Left: Simulations were performed in which the EB1 protofilament-edge on-rate was set to zero, and the closed-lattice on-rate was gradually increased. Right: Simulated kymographs in which the EB1 protofilament-edge on-rate was set to zero, and the on-rate at closed-lattice sites was gradually increased (scale bars: 2 µm and 10 s). (B) Left: Simulations were performed in which the closed-lattice on-rate remained constant at its baseline (non-zero) value, and the protofilament-edge on-rate was gradually increased. Right: Simulated kymographs in which the closed-lattice on-rate remained constant at its baseline (non-zero) value, and the protofilament-edge on-rate was gradually increased (scale bars: 2 µm and 10 s). (C) Left: Simulated images of EB1-GFP tip tracking over a range of closed-lattice on-rates (scale bar: 1 µm). Center: Line scans from simulated images of EB1-GFP intensity for a range of closed-lattice on-rates (error bars, SEM). Right: Tip:Lattice EB1-GFP intensity ratio vs closed-lattice on-rates in the simulation (error bars, SEM). The tip:Lattice EB1-GFP intensity ratio decreases with increasing closed-lattice on-rates. (D) Simulated kymograph in which the closed-lattice on-rate is set to zero partway through the simulation, and later returned to its baseline value (scale bars: 2 μm and 20 s). (E) Left: Simulated images of EB1-GFP tip tracking over a range of protofilament-edge on-rates (scale bar: 1 µm). Center: Line scans from simulated images of EB1-GFP intensity for a range of protofilament-edge on-rates (error bars, SEM). Right: Tip:Lattice EB1-GFP intensity ratio vs protofilament-edge on-rates in the simulation (error bars, SEM). Localization to the microtubule tip increases with increasing protofilament-edge on-rates. (F) Simulated kymograph in which the protofilament-edge on-rate is set to zero partway through the simulation and later returned to its baseline value (scale bars: 2 μm and 20 s). (G) Top: Representative images of EB1-GFP tip tracking for increasing Protofilament-edge:Closed-lattice on-rate ratios. Bottom: Tip:Lattice EB1-GFP intensity ratio for increasing Protofilament-edge:Closed-lattice on-rate ratios (GDP:GTP off-rate ratio is constant and set to 12:1). The experimentally measured Protofilament-edge:Closed-lattice on-rate ratio is 50–100 (Reid et al., 2019) (gray dashed boxes). (H) Top: Representative images of EB1-GFP tip tracking for increasing GDP:GTP closed-lattice off-rate ratios. Bottom: Tip:Lattice EB1-GFP intensity ratio for increasing GDP:GTP closed-lattice off-rate ratios (Protofilament-edge:Closed-lattice on-rate ratio is constant and set to 50:1). The experimentally measured GDP:GTP closed-lattice off-rate ratio is 6–12 (Maurer et al., 2011) (gray dashed boxes). (I) Top: Representative images of EB1-GFP tip tracking without protofilament-edge binding. Bottom: Tip:Lattice EB1-GFP intensity ratio for experimentally measured GDP:GTP closed-lattice off-rate ratios, with (red) or without (blue) EB1 binding at protofilament-edge sites.

