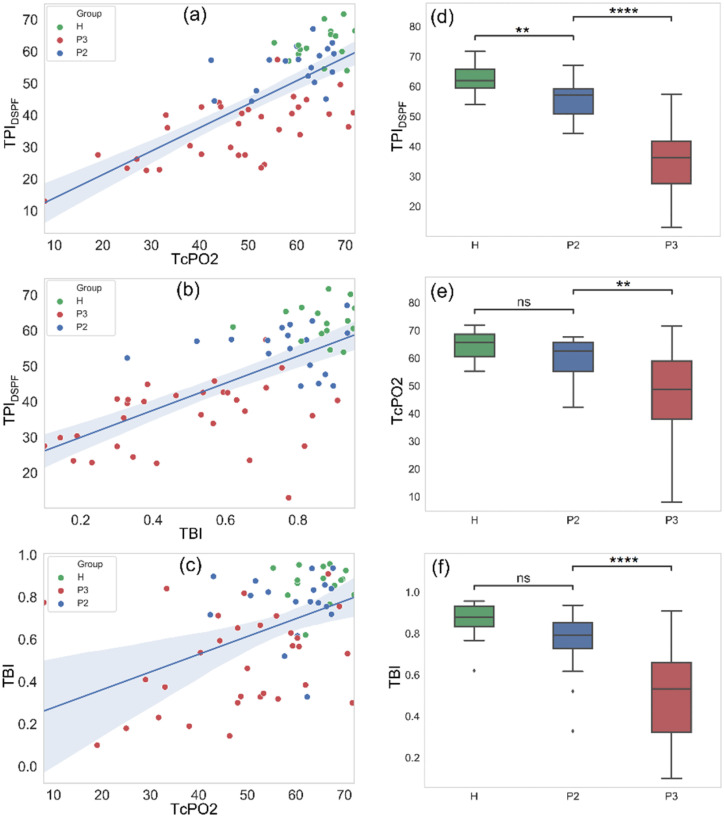
FIG. 1.
Correlation between (a) TcPO2 and TPIDSPF, (b) TBI and TPIDSPF, and (c) TcPO2 and TBI. H (green) represents healthy subjects, P2 (blue) represents DM patients without PAD, and P3 (red) represents DM patients with PAD. Pearson's correlation coefficients are 0.720, 0.652, and 0.474 for (a), (b), and (c), respectively. Boxplots of the three groups (H, P2, and P3) under the measurement of (d) TPIDSPF, (e) TcPO2, and (f) TBI.

