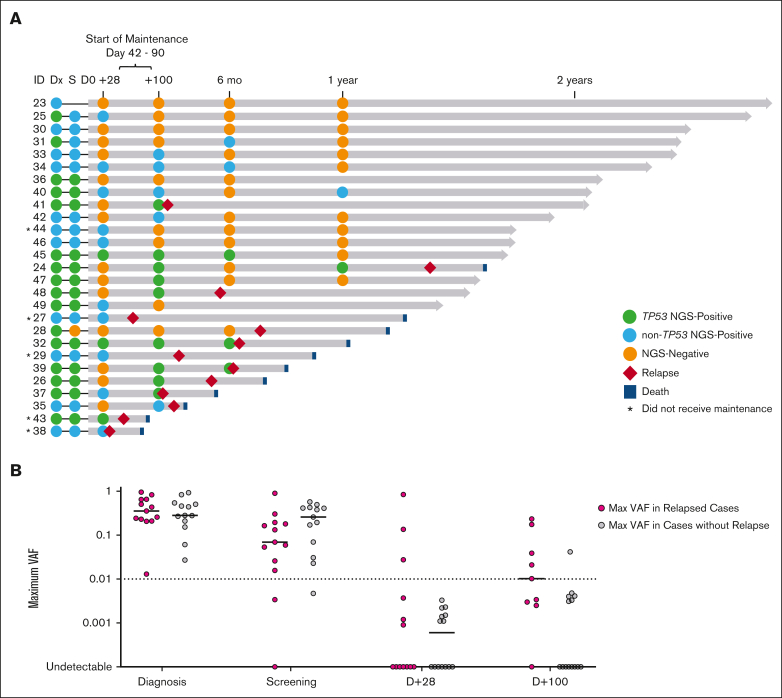
Figure 4.
Serial molecular MRD surveillance before and after transplant. (A) Molecular MRD swimmer plot. Each bar represents a patient, with the length of gray bars indicating follow-up time. Patients arranged by follow-up time and labeled by patient/study ID number. Recommended window for maintenance initiation indicated (day +42 to day +90). Symbols indicate molecular status (defined as detection of pre-allo-SCT mutation) at serial time points, relapse, and death; asterisk indicates those that did not receive maintenance (n = 5), and blue- or green-filled circles indicate TP53 mutation status. Notably, ID 40 had molecular MRD positive clone detected at 1 year (RUNX1 p.L175fs at VAF of 0.19%) but did not relapse at time of data cutoff. (B) Plot of mutational burden by VAF over time early in the transplant course. Line presents median. VAF > 0.01 (1%) at day +100 identifies cases that are most likely to relapse. One exception to this is a 4.8% VAF TP53-mutated clone identified at day +100 that was not detected at subsequent time points.

