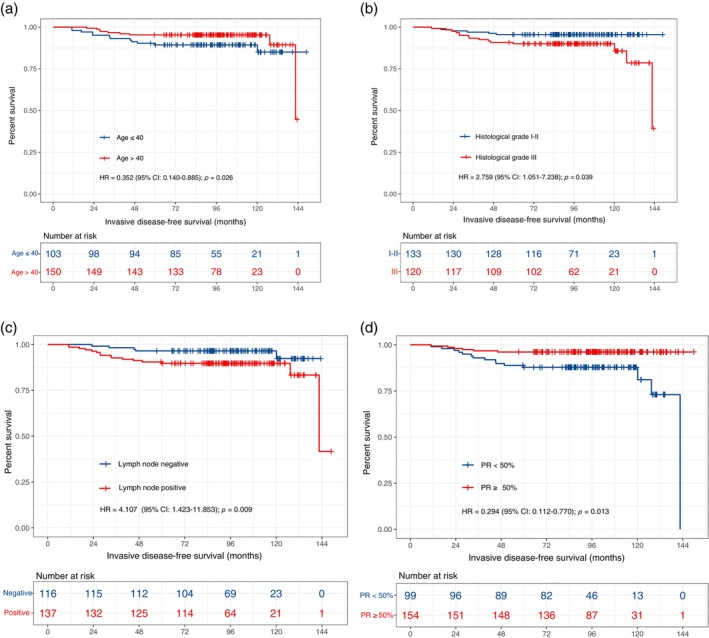
FIGURE 3.

Kaplan–Meier curves of IDFS of patients in different subgroups. (a) Kaplan–Meier curve of IDFS for patients in age ≤40 versus age >40 group. (b) Kaplan–Meier curve of IDFS for patients in histological grade I–II versus histological grade III group. (c) Kaplan–Meier curve of IDFS for patients in lymph node‐negative versus lymph node‐positive group. (d) Kaplan–Meier curve of IDFS for patients in PR <50% versus PR ≥50% group. CI, confidence interval; IDFS, invasive disease‐free survival; HR, hazard ratio; IDFS, invasive disease‐free survival; PR, progesterone receptor.
