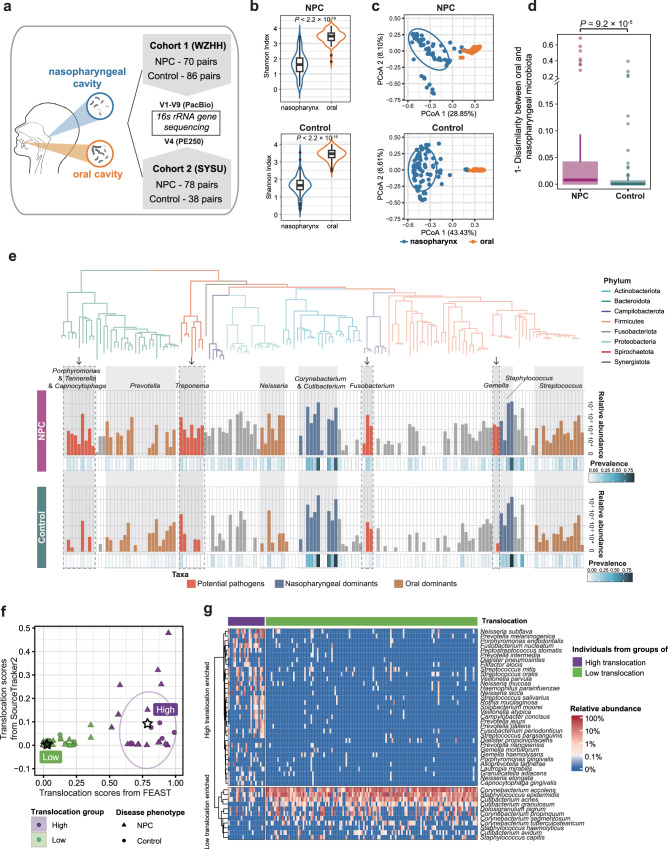
Fig. 1. The influx of oral microbes shaped two types of nasopharyngeal microbial communities.
a Designs of NPC case-control microbiota study. b The Violin plots of Shannon alpha diversity index between nasopharyngeal and oral microbiota. P values between the two groups were determined by the Wilcoxon rank-sum test (two-sided). Overlayed boxplots were presented with the median marked by thick black line, the interquartile range marked by the white bar, the range by the thin black line and outliners by the black dots (N = 70 for NPC, and N = 86 for control). c The PCoA plots based on Bray-Curtis distance within NPC patients (N = 70) or controls (N = 86). PCoA analysis was applied in combined NPC and control samples, and plots were presented separately on the same set of axes. Ellipses with 75% levels were shown. d The oral-nasopharyngeal paired Bray-Curtis distance between NPC patients and controls. P values between the two groups were determined by the Wilcoxon rank-sum test (two-sided). Boxplots were presented with the median marked by thick line, the interquartile range marked by the bar, the range by the thin line and outliners by dots (N = 70 for NPC, and N = 86 for control). e The phylogenetic tree represented ASVs of core species with >5% presence in nasopharyngeal microbiota. The phylogenetic tree was constructed by Mega7 software using the neighbor-joining method. The bar plots indicated the relative abundance of these species in nasopharynx which the filled colors indicate the types of microbes (top three commensal genera of nasopharynx and oral cavity, or potential pathogens). The heatmap indicated the prevalence of microbes in nasopharynx. f The scatter plot showing the two translocation clusters divided based on results from FEAST and SourceTracker2 algorithms using k-means methods. Ellipses with 75% levels were shown. Star represented the center of each cluster. g The heatmap showing the significant differential species between high- (N = 21) /low- (N = 135) translocation groups based on nasopharyngeal microbiota data (ANCOM-BC, two-sided, FDR q < 0.05) with adjusting for age, sex, cigarette smoking status, alcohol drinking status, whether have caries and whether have oral or nasal diseases. b–g were plotted based on data from Cohort 1. PCoA principal coordinate analysis, ASV amplicon sequence variant, FEAST fast expectation-maximization microbial source tracking, ANCOM-BC analysis of compositions of microbiomes with bias correction, FDR false discovery rate. Source data are provided as a Source Data file.

