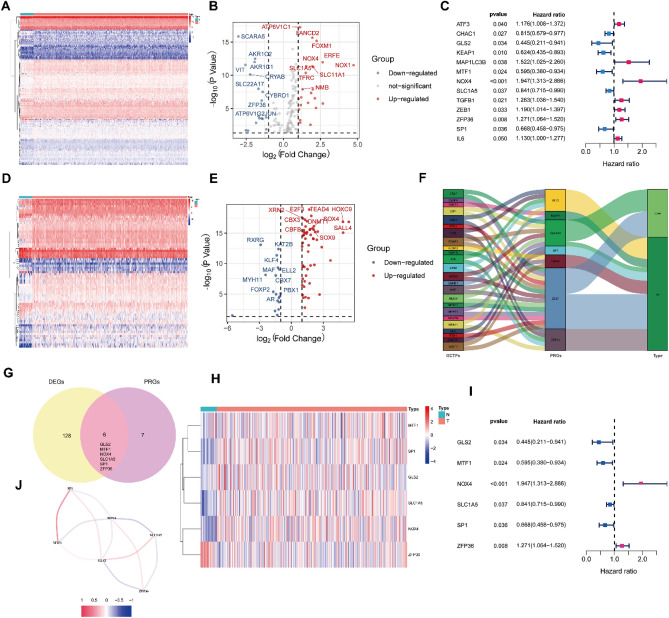
Figure 1.
Identification the prognostic ferroptosis- and iron metabolism-related differentially expressed genes in GC. (A) Heatmap exhibited the expression levels of the DEGs between normal tumor and tissue. (B) Volcano plot of DEGs. (C) Forest plot showed the PRGs were associated with OS. (D) Heatmap exhibited the expression levels of the GCTFs between normal tumor and tissue. (E) Volcano plot of GCTFs. (F) Sankey plot of GCTFs and PRGs represented the regulatory network. (G) Venn diagram to determine the PRDEGs by intersecting DEGs and PRGs. (H) Heatmap exhibited the expression levels of the PRDEGs between normal tumor and tissue. (I) Forest plot showed the PRDEGs were associated with OS. (J) The correlation network of PRDEGs.

