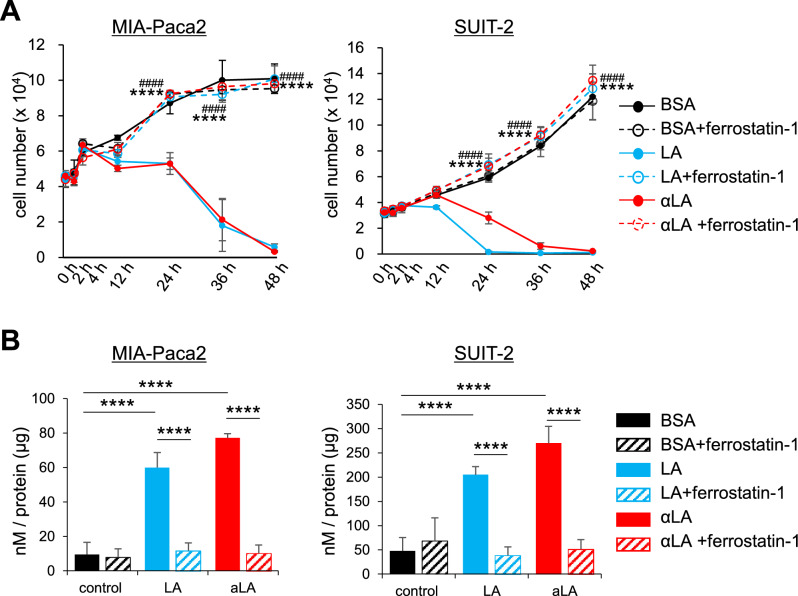
Figure 2.
LA and αLA induced pancreatic cancer cell death through ferroptosis. (A) The proliferation rate of MIA-Paca2 and Suit-2 cells treated with BSA, 60 µM LA, and 60 µM αLA alone or together with 10 µM ferrostatin-1. Live cells were counted successively up to 48 h. One-way ANOVA followed by the Tukey test was used for multiple comparisons. Data shown are the means ± SEM ****P < 0.00001 versus with LA treatment without ferrostatin-1, ####P < 0.00001 versus with αLA treatment without ferrostatin-1 (B) Bar graph showing lipid peroxidation of LA and αLA in MIA-Paca2 and SUIT-2 cells treated with BSA, 60 µM LA, and 60 µM αLA alone or together with 10 µM ferrostatin-1. Data shown are the means ± SEM ****P < 0.00001.

