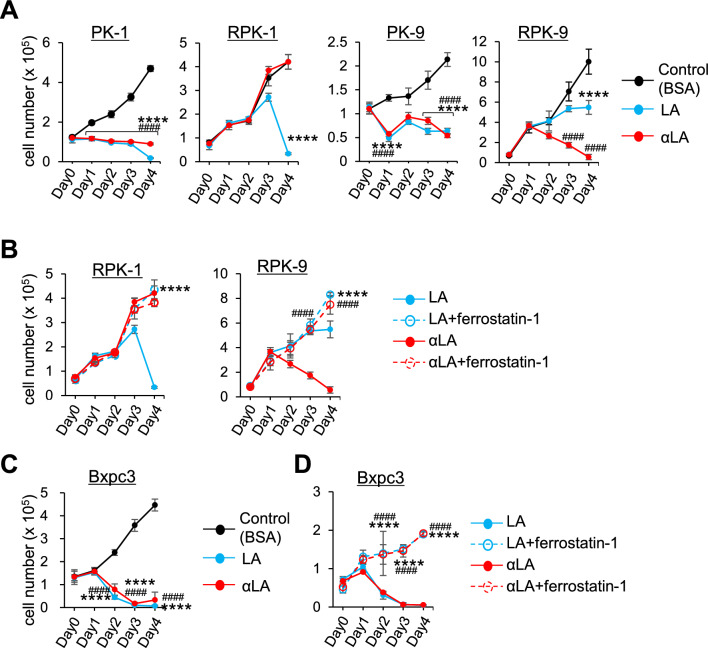
Figure 5.
LA and αLA had different anti-cancer effects on Gemcitabine-resistant pancreatic cancers. (A and C) The proliferation rate of PK-1, RPK-1, PK-9 and RPK-9 cells (A) and BxPC3 cells (C) treated with BSA, 60 µM LA, and 60 µM αLA (A). Live cells were counted successively for 4 days. One-way ANOVA followed by the Tukey test was used for multiple comparisons. Data shown are the means ± SEM ****P < 0.00001 BSA-control versus LA, ####P < 0.00001 BSA-control and αLA. (B and D) The proliferation rate of RPK-1 and RPK-9 cells (B) and Bxpc3 cells (D) treated with 60 µM LA, and 60 µM αLA alone or together with 10 µM ferrostatin-1. Live cells were counted successively for 4 days. One-way ANOVA followed by the Tukey test was used for multiple comparisons. Data shown are the means ± SEM ****P < 0.00001 between with and without ferrostatin-1 in LA-treated cells, ####P < 0.00001 between with and without ferrostatin-1 in αLA-treated cells.

