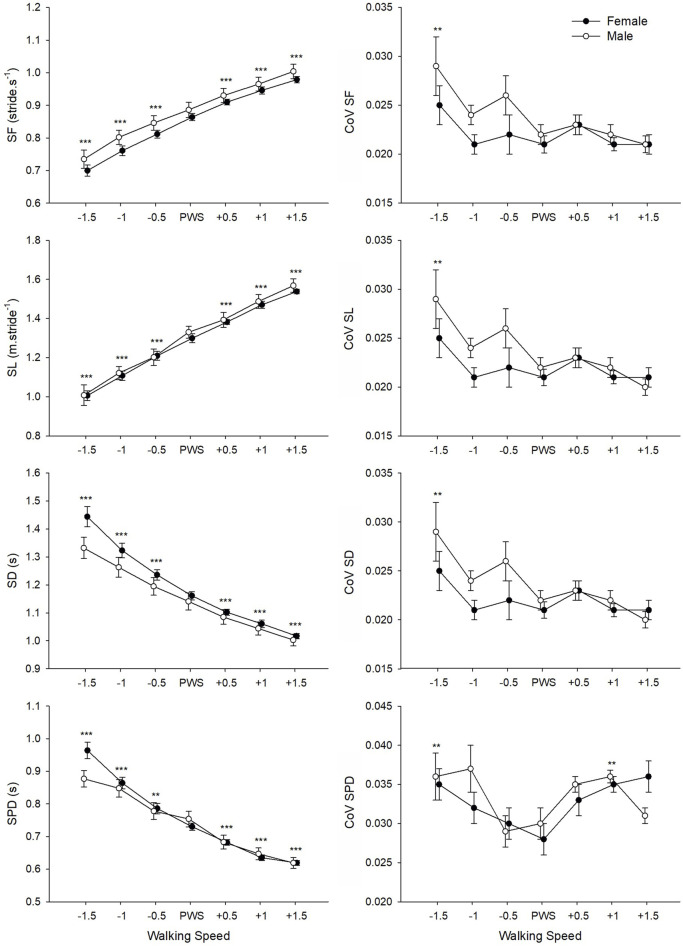
FIGURE 2.
Mean values of movement-related variables for male and female groups according to the seven tested speeds relative to the preferred walking speed (PWS) in km·h−1. SF, stride frequency; SL, stride length; SD, stride duration; SPD, support phase duration; CoV, coefficient of variation. Error bars represent the standard error. Significant speed-related differences are presented in comparison to PWS, * p < 0.05, ** p < 0.01, *** p < 0.001.

