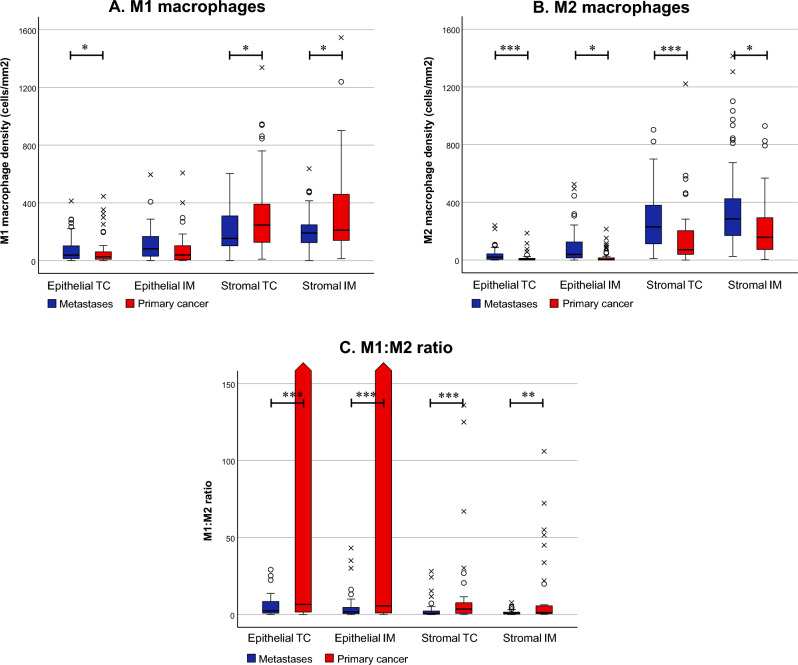
Fig. 3.
Macrophage polarisation in primary colorectal tumours and the corresponding first resected pulmonary metastases. Comparison of M1- (A) and M2-like macrophage densities (B) and M1:M2 ratios (C) between the primary tumours and pulmonary metastases. Rounds indicate outliers, and crosses indicate extreme outliers. The third and fourth quartile values for epithelial M1:M2 ratios were 203,503,770 and 20,083,912,500 in the tumour centre (TC) and 692,847,301 and 11,470,838,740 in the invasive margin of the primary tumours, respectively. ***p < 0.001, **p < 0.01, *p < 0.05. The statistical significance was tested with the Wilcoxon signed-rank test. Strom = stromal

