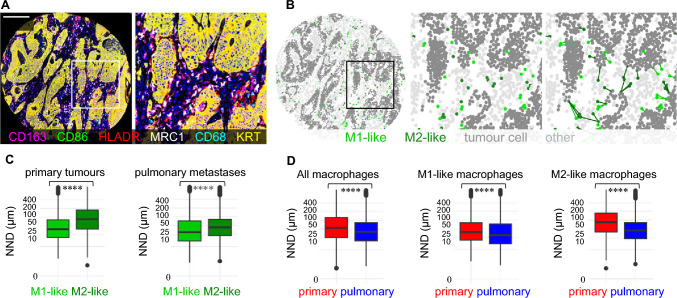
Fig. 4.
Spatial analysis of macrophages in primary tumours and in pulmonary metastases using the nearest neighbour distance (NND) function. A, Pseudocoloured multiplex immunohistochemistry image from an example tissue microarray core and from a smaller tumour region. B, Cell phenotyping maps with nearest neighbour distance analysis from each M1-like and M2-like macrophage to the closest tumour cell. C, Boxplots visualising the nearest neighbour distances (NNDs) from M1-like macrophages and M2-like macrophages to the closest tumour cell across all tumour images of primary tumours and pulmonary metastases. D, Boxplots visualise the distribution of nearest neighbour distances from all macrophages, M1-like macrophages, and M2-like macrophages to the closest tumour cell in primary tumours and pulmonary metastases. The results are based on 27,775 M1-like and 39,386 M2-like macrophages in the pulmonary metastases, and 146,438 M1-like and 83,159 M2-like macrophages in the primary tumours. The statistical significance was tested with the Wilcoxon rank-sum test. ****P < 0.0001

