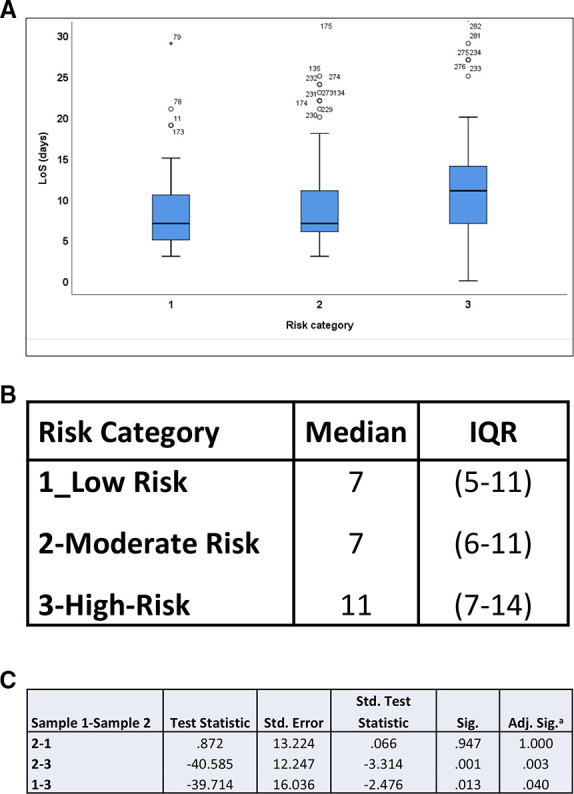
Figure 3.

Box plots depicting the distribution of length of stay (LoS)—values in transcatheter aortic valve implant participants according to their respective risk category (A). No significant difference was found between low-risk and intermediate-risk groups (B). However, LoS was quite significantly higher in high-risk patients (C).
