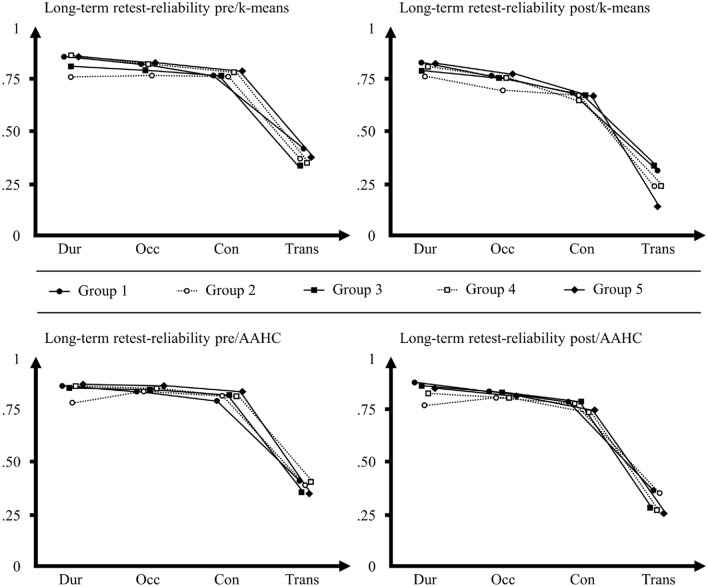
Fig. 3.
Average long-term retest-reliability of microstate characteristics in groups with different intervals between measures n = 525. y-axis: Intraclass correlation coefficient (ICC) scale ranging from zero to one. x-axis: Microstate characteristics (Dur durations, Occ occurrences, Cov coverages, Trans transitions). pre = pre-measures, post = post-measures, k-means = k-means clustering, AAHC atomize and agglomerate hierarchical clustering; Legend: Group 1 = interval of 1–7 days, Group 2: interval of 8–30 days, Group 3: interval of 31–90 days, Group 4: interval of 91–180 days, Group 5: interval of 181 days and more. Top: Average ICCs of microstate characteristics across types for each group, showing their long-term retest-reliability for pre-measures and k-means clustering (top left) and post-measures and k-means clustering (top right). Bottom: Average ICCs of microstate characteristics across types showing their long-term retest-reliability for pre-measures and AAHC (top left) and post-measures and AAHC (top right; see Table S15 in the supplementary material for information on group differences between average ICCs as indicated by z-tests). Notably, there was no systematic decrease of the retest-reliability with increasing intervals between day one and day two across all four conditions

