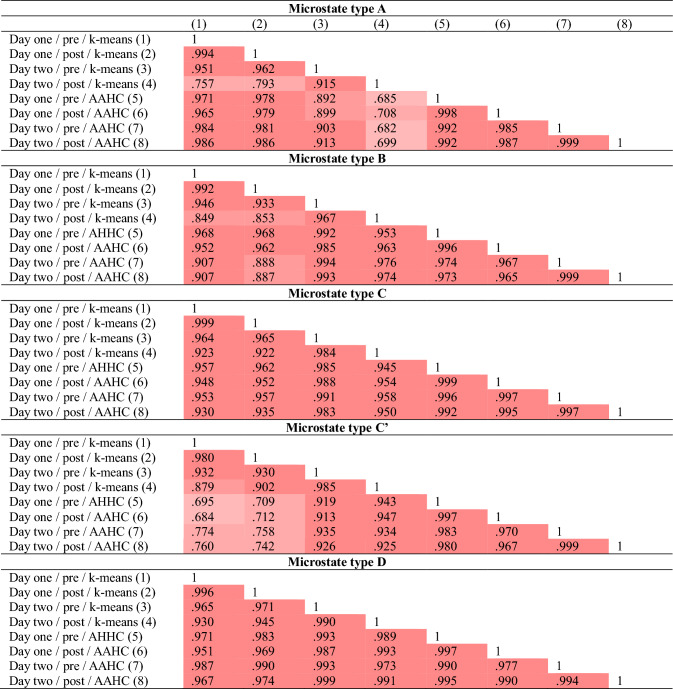
Table 2.
Spatial correlations of grand-mean microstate maps within each microstate type
Spatial correlations of grand-mean microstate maps within different microstate types (A, B, C, C′, D). Different shades of red indicate strengths of correlations (lighter shades indicate weaker correlations). On average, grand-mean microstate maps of type A, B, C, C′, and D correlated with r = .912, r = .953, r = .967, r = .885, and r = .980, respectively, across days (day one/day two), measurements (pre/post), and clustering procedures (k-means/AAHC)

