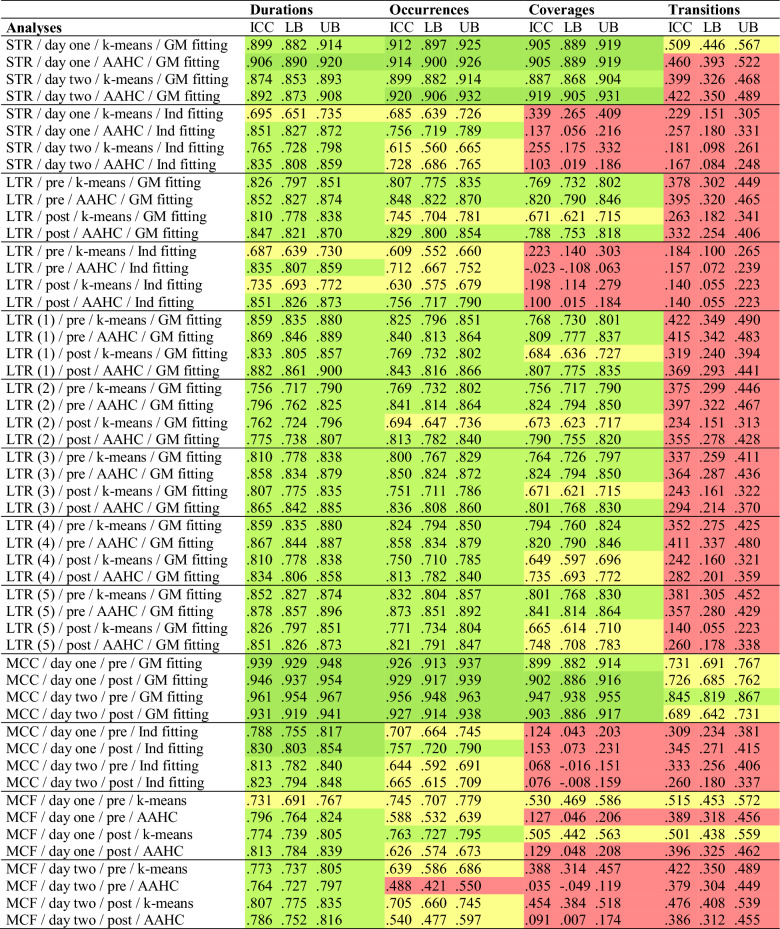
Table 3.
Average ICCs of durations, occurrences, coverages, and transitions for all analyses
STR Short-term retest-reliability (n = 583 for day one; n = 542 for day two), LTR long-term retest-reliability (n = 525), MCC methodological consistency of clustering procedures (n = 583 for day one; n = 542 for day two), MCF methodological consistency of fitting procedures (n = 583 for day one; n = 542 for day two). k-means = k-means clustering, AAHC atomize and agglomerate hierarchical clustering; GM fitting = GM fitting, Ind fitting = Ind fitting. Shown are average intraclass correlation coefficients (ICCs; model = two-way, type = agreement, alpha = .05; averaging according to Fisher’s (1915) algorithm) of durations, occurrences, and coverages across the five microstate types (A, B, C, C’, D), and average ICCs of transitions across the 20 transition types. Red (.00 < ICC < .50) = poor reliability; yellow (.50 < ICC < .75) = moderate reliability, light green (.75 < ICC < .90) = good reliability, dark green (ICC > .90) = excellent reliability

