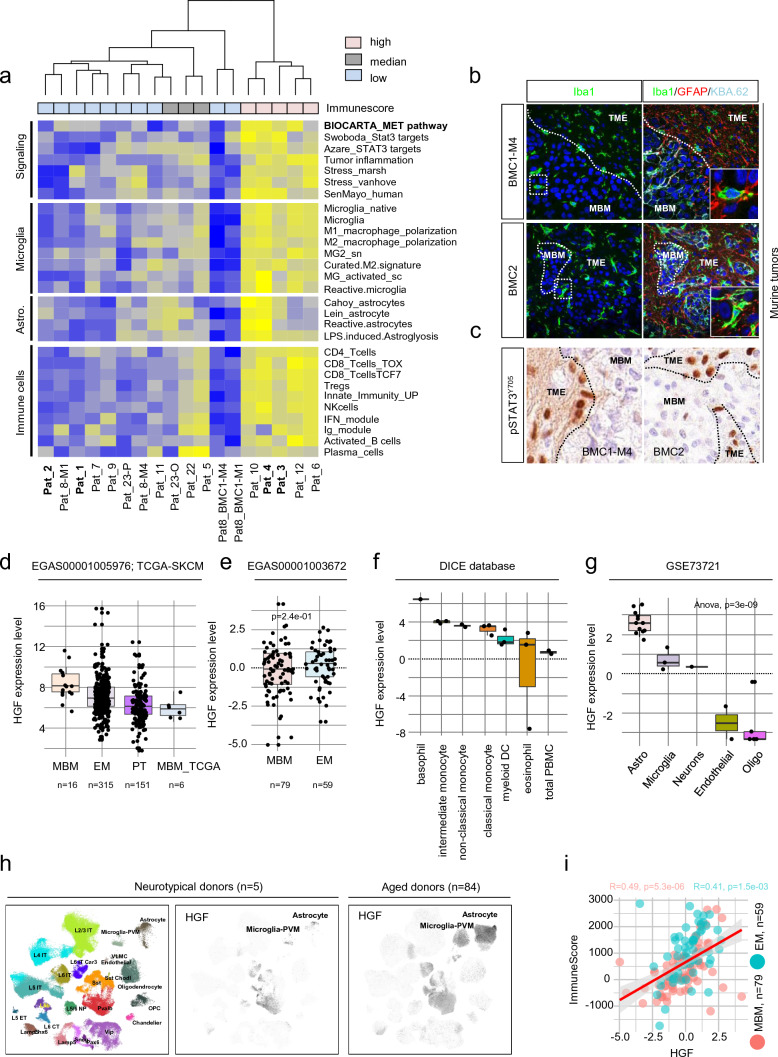
Fig. 3.
Signature-based deconvolution identified the parameter of MBM featuring a favorable disease course and identified a role of MET signaling. a Single-sample GSEA (ssGSEA)-based deconvolution of MBM of study EGAS00001005976 using customized gene signatures indicating “Signaling” processes, cellular subsets and stages of microglia and astrocyte and immune cell subsets. ssGSEA demonstrated distinct separation of MBM with high, median or low immune score regarding expression levels of signature genes, BMCs served as controls. ssGSEA uncovered differentially activated pathways and processes such as MET and STAT3 and interferon signaling, senescence (SenMayo), stress response and tumor inflammation in tumors enriched for reactive microglia and astrocytes and innate and acquired immune cells subsets. b Confocal microscopy images of orthotopic tumors established by stereotactic injection of BMC1-M4 or BMC2 cells into brains of Crl:CD1-Foxn1nu mice [49], stained for Iba1 (green, microglia) or Iba1, GFAP (red, astrocytes) and KBA.62 (turquoise, pan-melanoma cell marker). DAPI served as a nuclear counterstain. Markers show distinct areas of tumor (MBM) and microenvironment (TME) and regions of microglia infiltration, 21 days after intracranial injection [49]. MBM-TME boarders are indicated by white, dashed lines. c IHC of tumors investigated in (b) for activation and tyrosine phosphorylation (residue Y705) of STAT3. pSTAT3Y705 is particularly present in microenvironmental cells (astrocytes). Black, dashed lines indicate MBM-TME boarders. In b, c, bars indicate 50 µm. d-e Expression levels of hepatocyte growth factor (HGF) in tumors of studies EGAS00001005976, TCGA-SKCM and EGAS00001003672 demonstrating HGF expression in all tumor subsets. f, g Investigation of HGF expression in immune cell subsets (DICE database [61]) and brain cells (study GSE73721) revealed the highest levels in basophil granulocytes and monocytes (f) and in astrocytes and microglia (g). h UMAP projection of expression profiles from nuclei isolated from 5 neurotypical donors as provided by Seattle Alzheimer’s disease brain cell atlas (https://portal.brain-map.org/explore/seattle-alzheimers-disease), cellular subtypes are color coded (left panel). Log-normalized expression levels of HGF in nuclei isolated from 5 neurotypical donors (center panel). Log-normalized expression levels of HGF in nuclei isolated from 84 aged donors (42 cognitively normal and 42 with dementia), right panel, demonstrating an increased number of HGF expressing microglia and astrocytes as triggered by inflammatory processes. i Dot plot showing the correlation of HGF expression and immune score of BM (R = 0.49, p = 5.3e-06) and EM (R = 0.41, p = 1.5e-03) indicating a potential role of HGF in immune cell-related processes. Box and whisker plots show median (center line), the upper and lower quartiles (the box), and the range of the data (the whiskers), including outliers (d–g). Significance was determined by unpaired, two-sided t-test (e) or one-way ANOVA (g)

