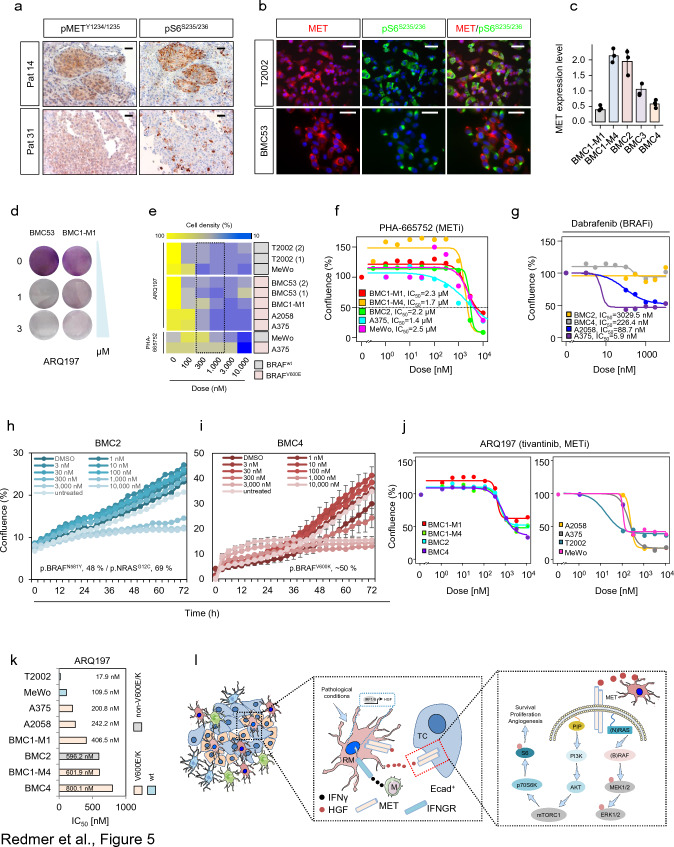
Fig. 5.
Inhibitors of MET receptor decrease the growth of brain metastatic and conventional melanoma cell lines. a Comparative IHC of selected MBM for levels of phosphorylated and activated MET receptor (pMETY1234/1235) and ribosomal protein S6 (pS6235/236) of consecutive sections suggesting MET-associated activation of mTOR signaling. b Immunofluorescence microscopy of lymph node-metastatic (T2002) and brain metastatic (BMC53) patient-derived melanoma cell lines for the co-occurrence of MET (red) and pS6235/236 (green). DAPI served as a nuclear counterstain. c qPCR analysis of BMCs for expression of MET receptor, bars indicate median levels ± SD of three biological replicates. d Gross initial ARQ197 sensitivity test of BMC53 and BMC1-M1 cells showing high and low levels of MET expression. Cell density was determined by crystal violet staining. e Broad range determination of sensitivity of BMCs, T2002 and conventional melanoma cell lines (A375, A2058, MeWo) to METi PHA-665752 and ARQ197. Cell density and BRAF mutation status are indicated. Dotted line depicts the estimated range of IC50. f PHA-665752 dose–response fit curve-based calculation of IC50 values of A375 cells with overexpression of NGFR or RFP control cells and MeWo cells. g Dabrafenib dose–response fit curve-based calculation of IC50 values of BMCs exhibiting different BRAF mutations (BMC2p.N581Y, BMC4p.V600K) and A375p.V600E, A2058p.V600E cells. h, i Live cell imaging-based tracking of confluence (%) of BMC2 and BMC4 cells in dependence of increasing doses of ARQ197. Shown are median values ± SD of eight technical replicates. A representative out of two experiments is shown. j ARQ197 dose–response fit curves of BMCs, T2002 and conventional cell lines. Calculated IC50 values are indicated, suggesting the response of dabrafenib-resistant cell lines to METi. k Bar diagram summarizing IC50 values (nM) indicating the response of indicated cell lines to ARQ197. The BRAF status is color coded. l Working model suggesting the activation of MET receptor signaling in adjacent tumor cells and in (reactive) microglia (RM) by microglia-released HGF. IRF-mediated HGF expression in turn is triggered by immune cell (monocytes/macrophages, M) released interferon-gamma. HGF binding to tumor cell (TC) expressed MET receptor directs downstream activation of the RAS/RAF/MEK/ERK and the PI3K/AKT/mTOR/p70S6K branch. The latter is leading to phosphorylation and activation of the ribosomal protein S6. Box and whisker plots show the median (center line), the upper and lower quartiles (the box), and the range of the data (the whiskers), including outliers (c)

