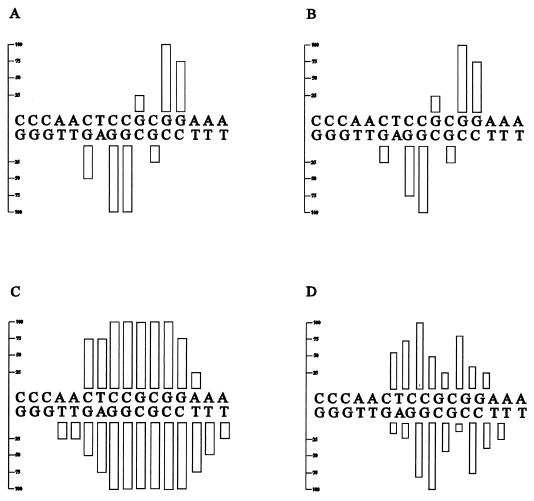
FIG. 6.
Densitometric scanning of footprints of binding site 2. (A) Methylation interference analysis, showing reduction in relative binding as a consequence of methylation of guanines. (B) Methylation protection analysis, showing reduction in relative methylation of guanines in the protein-DNA complex. (C) Purine and pyrimidine missing-base analysis, showing reduction in relative binding as a consequence of loss of each nucleoside. (D) Reduction in relative binding as a consequence of ethylation of each phosphate. Differences in the labelling of the lanes were normalized by equating the absorbance of bands clearly outside the interfering area for the free and bound lanes. All the experiments were carried out with the NirA(1–125) peptide; the probe is as in Fig. 2 through 4.

